Attribution Window Choices and Their Revenue Reporting Impact
Different attribution windows explain why your dashboard and bank account never agree.

Same week, three ad platforms, three different revenue numbers, and a Shopify backend showing a fourth number lower than all of them. None of this is a tracking bug. It's the designed behavior of attribution windows, each platform crediting the same sale to itself, and the gap between what the dashboards say and what the bank account shows comes straight from window-length choices most operators never touch after setup. What follows is the arithmetic behind why the numbers move the way they do, so a founder can read a dashboard the way an auditor reads a balance sheet: with the mechanics in view, and some suspicion.
What an attribution window is and what it controls
An attribution window is the stretch of time after someone clicks an ad, sees an ad, or opens an email during which a platform will still credit a later purchase to that touchpoint. Set a 7-day click window on Meta, and any purchase within 7 days of a click gets logged as ad-driven revenue, whether or not the ad had anything to do with it.
That one setting controls three things at once: how many conversions a campaign gets credited with, how much revenue those conversions add up to, and how that channel stacks up against every other channel in the account. Changing the window does not change any of the underlying customer behavior. Only the math does.
Window type matters as much as window length. A click-through window and a view-through window behave completely differently even at the same number of days, because a click implies some action, while a view can mean someone scrolled past an ad on their phone without registering it at all. Meta's default setup, a 7-day click window plus a 1-day view-through window, routinely captures conversions that would have happened with or without the ad. None of these defaults exist for the brand's benefit. They exist because they make the platform look effective at driving sales, and the platform's revenue depends on advertisers believing that story.
The purchase cycle should determine the window. A fast DTC purchase, something cheap enough to buy on impulse, calls for a shorter window, while longer, more considered purchases may warrant extending the window considerably further. Whatever gets chosen has to apply the same way across every platform in the stack, or the comparisons downstream stop meaning anything. A window is a dial on a reporting tool. It is not a measurement of what shoppers actually did, and treating it as one is where most of this goes wrong.
How a longer window inflates reported revenue without a single additional sale
Stretch a click window from 7 days to 28 days and the platform now claims credit for every purchase made that entire month by anyone who so much as clicked an ad, regardless of what actually drove the decision to buy. Nothing about the shopper's path changed. The credit window just got wider, and the platform got more expensive-looking for free.
View-through attribution pushes this further. A shopper scrolls past a display ad, doesn't click, doesn't consciously register it, then searches the brand by name three weeks later and buys. If the view-through window covers that gap, the ad platform claims the sale as its own, even though the impression likely had nothing to do with the purchase.
Deduplication failures make it worse. Without clean logic across platforms, one purchase can generate multiple separate conversion credits: once on Meta, once on Google, once in Klaviyo. That triple-counting makes middling campaigns look like standouts, and across a study of more than 200 e-commerce brands in 2025 and 2026, platforms overstated true ROAS by a factor of 2.3x. That's about as clean a number as exists for how far dashboard reporting drifts from what actually happened.
None of this drift runs in a random direction. It consistently favors the platform's own reported numbers, because the business model depends on advertisers keeping the spend flowing. A brand that never audits its window settings is reading a number the ad platform optimized for its own revenue, not the brand's.
How a shorter window deflates performance and hides what is working
Running the mistake in reverse makes the damage look different, but it costs just as much. Setting a 1-day click window on a channel where shoppers typically take a week to decide strips away every conversion landing outside that single day and hands it to whatever touchpoint happened to come last.
Upper-funnel channels take the brunt of it. YouTube pre-roll, podcast reads, out-of-home, long-form video creative: attribution windows almost never count these as the final click in a purchase path. A short or click-only window undervalues them systematically, not because they underperform, but because of how the window gets built in the first place. Last-click attribution compounds the problem by handing 100% of conversion credit to whatever the shopper clicked right before buying, wiping out every touchpoint that came before it. That model earns its keep for daily pacing decisions. It has no business anchoring budget allocation, and treating it as the final word here is the single most common mistake in this whole discipline.
Sophisticated DTC operators have increasingly shifted a meaningful share of budget into upper-funnel spend: video, podcasts, brand content. Almost none of that spend clears in last-click reporting, so the dashboard shows it as dead weight. Brands then cut channels that are genuinely contributing to growth, simply because no window in use was ever built to catch that contribution.
Over-attribution leads to overspending on channels that look better than they are. Under-attribution leads to premature cuts of channels that are actually working. Both errors eat into margin. They just come from opposite directions, and most operators only ever guard against one of them.
Why comparing channel performance across mismatched windows is meaningless
Running the numbers side by side on any DTC stack makes the mismatch appear fast. Meta might run a 7-day click and 1-day view window. Google Ads applies its own data-driven model that shifts credit dynamically. Klaviyo claims email revenue on an open-based or click-based window, and GA4 defaults to data-driven attribution that quietly falls back to last-click once traffic volume drops low enough.
Adding all four platforms' reported conversions together produces a total that runs 30 to 100% higher than what actually happened. That's the mechanism behind a familiar scene in marketing meetings everywhere: Meta claims a strong return, Shopify's backend shows a much lower number, and nobody agrees which number to trust.
Roughly 75% of companies use some form of multi-touch attribution by 2025, yet 41% of marketers still default to last-touch models, per Ruler Analytics. Most cross-channel comparisons happening right now are last-click measurement sitting next to some other model entirely, with nobody flagging the mismatch.
The failure appears in real budget decisions. A brand sees Meta reporting a 2.2:1 ROAS next to Google branded search reporting a far higher number, and reallocates spend toward branded search. But Common Thread Collective's geo-holdout testing database puts the median incremental ROAS of Google branded search at just 0.27x. The comparison was never apples to apples, because the two numbers were never measuring the same thing. Channel comparison only means something when window length, model type, and deduplication logic stay constant across everything being compared. Otherwise the exercise amounts to comparing a ruler to a scale and calling whichever one gives the bigger number the winner.
Branded search is where attribution window fiction is most expensive
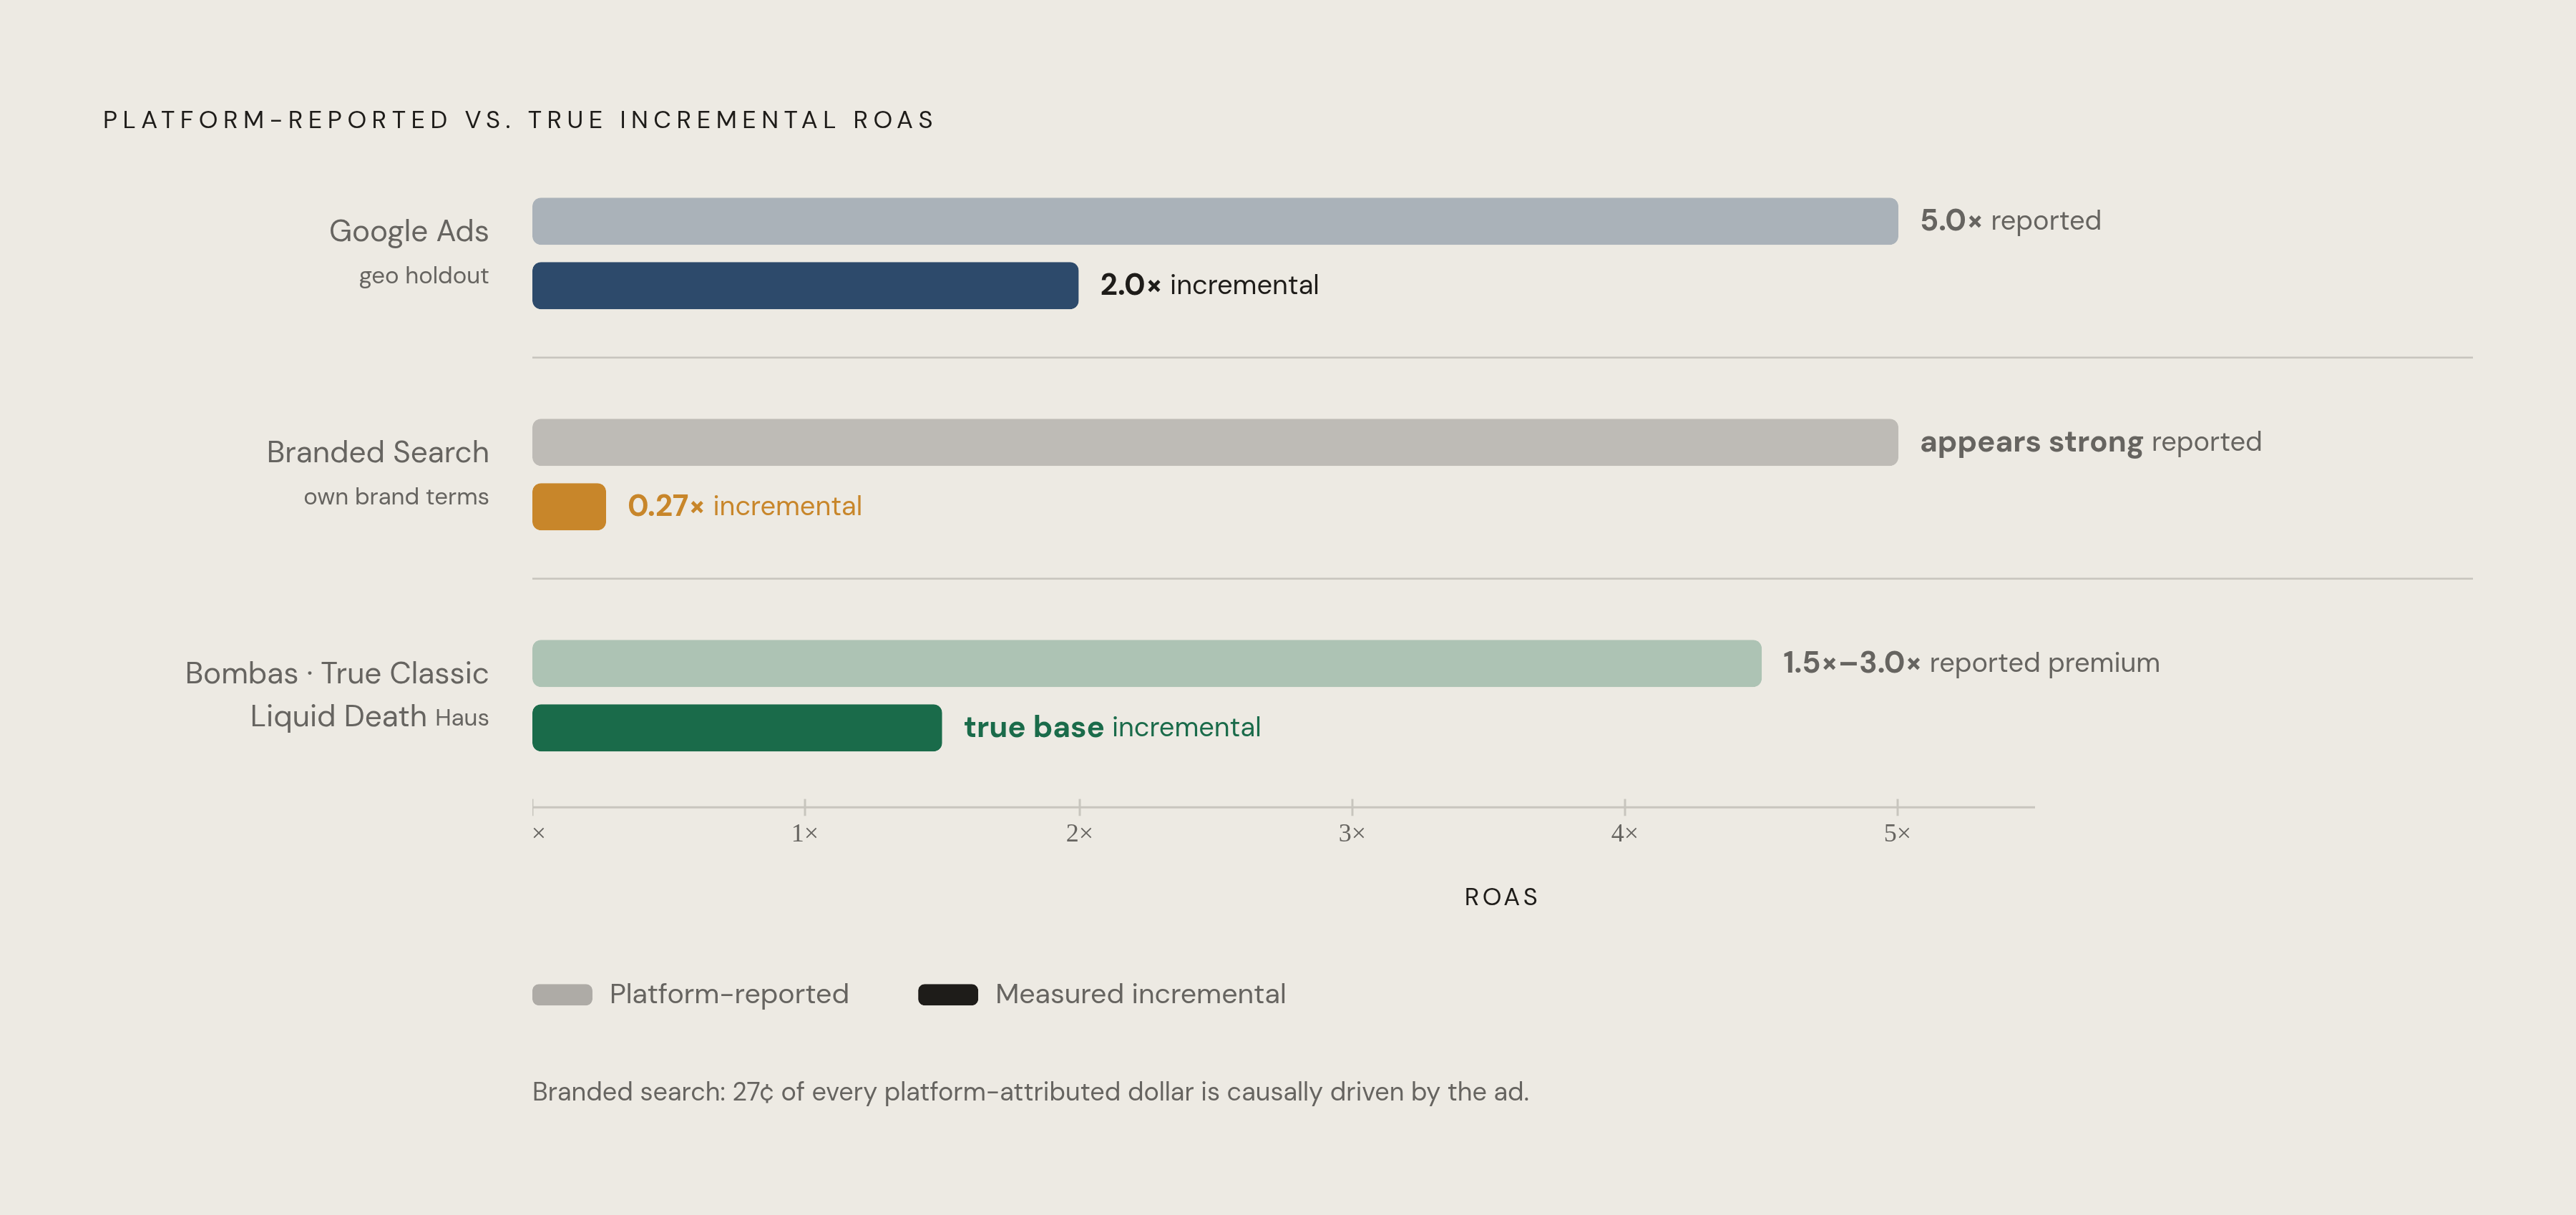
Branded search looks like a star performer in last-click reporting for a simple reason: it's almost always the last click. The shopper already decided to buy, typed the brand's name into Google, clicked the ad sitting above the organic result, and completed the purchase. The ad didn't create that intent. It sat in front of demand that already existed and took the credit anyway.
Common Thread Collective's database of real geo-holdout tests puts the median incremental ROAS of Google branded search at 0.27x. Out of every dollar of revenue branded search reports as attributed, only 27 cents is actually caused by the ad spend. The other 73 cents would have shown up anyway through organic demand that already existed.
That figure doesn't mean cutting branded search spend to zero. Defending the brand name from competitor bidding carries strategic value a pure incremental ROAS number won't capture. It means treating that dashboard figure as protection money, not growth, and budgeting for it accordingly instead of celebrating it as a top channel.
Meta retargeting runs the same play. Agency data cited in industry research shows retargeting-heavy programs over-attributing by 30 to 50%, for the same reason as branded search: retargeting mostly recaptures demand that already existed rather than generating new demand. Haus's public case studies with Bombas, True Classic, and Liquid Death found platform-reported ROAS overstating measured incremental ROAS by 1.5x to 3x, and the widest gaps occurred on the exact placements that looked strongest on the dashboard. The channels that appear most impressive in windowed attribution are frequently the ones where window choice, not performance, is doing most of the work.
Signal loss has made every attribution window less reliable than it was in 2020
Attribution windows haven't just gotten less trustworthy because of how they're configured. The data feeding them has thinned out. When one major mobile platform rolled out its app tracking transparency prompt in its operating system, opt-in rates for tracking fell from somewhere around 70 to 80% before the change down to roughly 27% in the most recent benchmarks, per Appsflyer. Platforms responded by modeling the missing conversions statistically instead of measuring them, so a growing share of every "attributed" conversion is now a platform's best guess dressed up as fact.
Client-side pixels miss somewhere between 20 and 40% of conversions due to ad blockers, Safari's Intelligent Tracking Prevention, and consent rejections. Google reversed course on Chrome cookie deprecation in July 2024, moved toward a "user choice" model, then confirmed by April 2025 that there would be no cookie deprecation and no standalone prompt at all. Safari and Firefox deprecated third-party cookies years earlier, though, so roughly half the web has run cookieless the entire time this back-and-forth played out.
A click window configured before the wave of privacy changes hit isn't pulling from the same population of trackable events it pulled from back then. The label on the setting never changed. The pool of data flowing into it shrank underneath it. Server-side tracking, Meta's Conversions API and Google's Enhanced Conversions, improves how much signal reaches the platform, but it doesn't make the reported window any more honest about incrementality. It just makes an incomplete measurement slightly less incomplete. A brand that hasn't revisited its window settings in several years is applying a reporting frame built for a signal environment that no longer exists.
What incrementality testing reveals that windowed attribution cannot
Incrementality testing asks a different question than any windowed model can answer. It measures how many conversions a campaign actually caused, against what the platform would have credited itself with anyway. Correlation and causation diverge here, applied directly to revenue reporting.
A worked example makes the gap concrete. A brand spends $50,000 on Google Ads. Google's dashboard reports $250,000 in attributed revenue, a 5x platform-reported ROAS. Running a geo holdout test on that same spend shows the actual incremental revenue comes out to $100,000, a true incremental ROAS of 2x. The platform wasn't lying, exactly. It was reporting correlation and calling it causation.
A more brutal version of the same test involved a major grocery chain that paused all non-branded paid search across 12 test markets and measured the sales impact. The lift came back at 0%. The campaign wasn't producing incremental sales at all, despite whatever ROAS the dashboard had been reporting the whole time.
Adoption is climbing but still far from universal. As of a July 2025 EMARKETER and TransUnion survey, 52% of US brand and agency marketers now run some form of incrementality testing, and 36.2% plan to increase spend on it over the next 12 months. Cost used to be the barrier: full incrementality experiments once required budgets around $100,000. Google brought that minimum down to roughly $5,000 by moving to Bayesian statistical models, putting the method within reach of brands that could never have justified it before.
Incrementality testing isn't built for daily pacing decisions, and last-click windows still have a legitimate job to do there. Windowed attribution answers what happened after the ad ran. Incrementality testing answers whether it would have happened anyway, and that second question is the one that should decide budget, not the first.
Matching window length to actual purchase behavior for your product category
Window length should track the real decision timeline of a first-time buyer, not whatever the platform ships with by default and not whatever a competitor happens to run. That's the whole governing principle, and most of the fixes downstream flow from it directly.
Fast, low-consideration DTC products, consumables and impulse buys, call for shorter click windows, with view-through windows kept minimal or excluded from revenue reporting altogether. Anything longer starts capturing organic demand and mislabeling it as paid-driven. Mid-consideration categories, apparel, footwear, home goods, can defensibly run 7 to 14 day click windows, but view-through attribution should stay short or get excluded from revenue reporting altogether. High-consideration purchases, furniture, fine jewelry, premium wellness products, can justify longer click windows since real deliberation takes time, but that assumption still needs checking against actual backend order data rather than being taken on faith.
The test itself is straightforward: pull the distribution of days-to-purchase for new customers straight from backend order data, and set the attribution window to cover the bulk of that distribution, not stretch past it to sweep in demand that was already moving toward a purchase regardless of ad exposure. Post-purchase surveys, the "how did you hear about us" prompt at checkout, remain an underused complement here. They pick up attribution signal no pixel can ever see, which matters most for upper-funnel channels that never generate a trackable click in the first place. Whatever window gets applied to Meta has to apply the same way to Google, to email, and to every other channel in the comparison. That consistency is what keeps the results comparable, regardless of which specific number gets picked.
Practical measurement setups by revenue stage, from launch to scale
Below a modest annual revenue threshold, keep it simple. Run last-click attribution on platform pixels alongside server-side event routing, and skip formal incrementality testing for now, since traffic and spend volume are almost certainly too thin to produce a clean geo holdout. Simple on/off tests do most of the useful work at this stage: pause a channel for one or two weeks and watch what happens to backend revenue, not what the platform dashboard claims happened. Set windows conservatively, a 7-day click with no view-through, so growth decisions don't get built on numbers inflated from the start.
Once annual revenue reaches a mid-range band, geo holdout testing starts to become viable, especially aimed at branded search and retargeting, and one structured test per quarter is a reasonable cadence. Keep last-click running for day-to-day pacing calls, but let incrementality results reset the quarterly budget split rather than daily bid decisions. Most ad platforms need somewhere around 300 to 400 monthly conversions before their algorithmic attribution models produce reliable output, and below that threshold, data-driven attribution is mostly guessing dressed up in a dashboard. Multi-touch attribution starts making sense once a brand runs three or more channels generating roughly 1,000 monthly conversions combined.
Past that higher revenue point, marketing mix modeling becomes genuinely practical. Modern MMM now runs on one-to-three-month cycles instead of requiring a full year of data, putting it within reach of mid-market DTC brands that couldn't have justified it a few years ago. Teams that implement multi-touch attribution properly at this stage report cost-per-acquisition improvements in the 14 to 36% range, with an average 19% ROI lift in the first year. The real risk at this scale is in organizational follow-through, not the modeling: these systems need a dedicated analyst who owns the process, and most implementations stall out within about six months once nobody holds that job.