Incrementality Testing for On-Site Conversion Tools
Incrementality testing reveals whether on-site tools actually drive sales.

Marketers have spent the past few years figuring out that paid-media attribution lies to them, quietly and in a consistent direction. The same structural flaw sits inside every popup, product recommendation widget, and AI chat assistant running on a DTC storefront right now, and almost nobody is testing for it. This piece lays out how incrementality testing, the discipline built to catch inflated ad performance, applies directly to on-site conversion tools, and what it takes to run that test correctly.
Every vendor dashboard reports lift. That's the whole business model. But dashboards built on attribution, whether they're tracking an ad click or a chat widget interaction, assign credit based on proximity to a touchpoint, not on whether that touchpoint actually changed the outcome. A shopper who was already three clicks from checkout gets counted as "influenced" the moment a recommendation carousel loads on the page. Attribution answers "was this tool present before the sale?" It cannot answer "would this sale have happened anyway?" That second question is the only one that matters, and it's the one incrementality testing is built to answer.
The gap between what attribution reports and what actually happened is not small. In paid media, platform-reported ROAS can run 2 to 3 times higher than true incremental ROAS, and for channels like branded search and retargeting, where the platform is often just catching demand that already existed, the gap can widen to 5 to 10 times. Haus's 2025 industry survey found that only 39% of marketers still named multi-touch attribution as their most trusted measurement method, a sign that confidence has been draining toward causal methods for a while now. On-site tools have avoided this scrutiny mostly because nobody's pointed the same lens at them yet. That's starting to change, and it should.
What incrementality testing measures, and why the concept transfers cleanly to the storefront
Incrementality is the difference in outcome between a group exposed to something and an equivalent group that wasn't. Not the correlated lift, the causal one. If a recommendation widget fires on a large number of sessions and a fraction of them convert, that tells you nothing on its own. You need to know what the conversion rate would have been on those same sessions without the widget. The difference between those two numbers, not the raw conversion count, is the actual contribution of the tool.
Three test designs dominate modern measurement programs. Geo tests compare outcomes across regions, holding one group as a control while another gets the treatment; this is the standard for paid media, and it adapts reasonably well to on-site features that can be toggled by geography or session segment. Randomized controlled tests, the classic A/B structure, assign individual users or sessions to treatment versus holdout, and this is the most natural fit for on-site tools because the storefront already controls the entire experience. Conversion lift tests, the platform-native tools built by Meta and Google, matter less here, but operators should understand where they sit in the broader landscape.
The holdout group is the mechanism, full stop. Without a holdout, a brand is measuring activity: clicks, opens, dwell time, whatever the dashboard likes to show. With one, a brand is measuring impact. On-site tools are actually easier to test rigorously than paid media, which should reassure DTC operators rather than intimidate them. A brand controls exactly who sees a given feature on its own storefront. There's no walled garden hiding half the data, no platform algorithm deciding who gets the treatment behind a black box. Randomization on-site can be clean in a way that randomization in an ad auction never is.
Engagement is not conversion. A chat assistant can drive more clicks, more time on page, more opened conversations, without moving a single additional purchase. Incrementality testing exists to isolate the metric that actually matters (completed purchases, revenue, repeat order rate) from the metrics that just make a feature look busy. The pattern recurs across categories: a brand turns a feature on, the native dashboard says everything's up, and then a real holdout test shows the incremental lift is a fraction of what the self-reported numbers claimed.
How to design a valid holdout test for an on-site tool
Three decisions determine whether a test is valid, and all three need to be locked before a single session gets logged. First, the unit of randomization: session-level, user-level by cookie or login, or geographic segment. Pick the unit at which the tool's behavior actually varies, even when a different unit is easiest to query in the analytics platform. Second, holdout size. Too small a holdout produces a result that looks directional but isn't statistically defensible, and shipping a decision off an underpowered test is worse than not testing at all, because it creates false confidence. Third, the assignment mechanism has to be both random and stable. A visitor assigned to holdout needs to stay in holdout for the full test window. Re-randomizing on every visit destroys the whole point of the exercise.
Duration matters more than most teams expect. Credible geo-holdout tests generally run 4 to 8 weeks, long enough to cover weekly purchase cycles and reach statistical significance. High-volume categories can sometimes get a directional read faster, but shortening the window on an on-site test is risky, since purchase intent shifts by day of week and by session type in ways a two-week snapshot won't capture.
Contamination is the quiet killer of these tests. Holdout visitors sometimes see the tool anyway, through device switching or logged-out sessions that don't carry the assignment cookie. Novelty effects inflate early results, lift that looks strong in week one and fades as users habituate to the new feature. And if a promotional event lands inside the test window but not in the comparison period, the whole read is confounded by seasonality rather than by the tool itself.
Baseline definition deserves its own scrutiny. Establish the pre-test conversion rate for the exact traffic segment being tested, since the site-wide average won't reflect that segment's baseline. A widget that only fires on product detail pages should be measured against product-detail-page conversion rate, not blended CVR across the whole funnel; blending the two will always make the widget look more powerful than it is. The primary metrics are incremental completed purchases and incremental revenue per session. Secondary metrics like add-to-cart rate or time-to-purchase are useful for diagnosing mechanism, for understanding why a lift happened, but they should never substitute for the revenue read itself.
For Shopify merchants looking for a practical entry point, Intelligems lets brands launch tests across pricing, shipping, and site content in under 15 minutes, with recommendations surfacing what to test next, and no developer required to get a test live.
The honest baseline problem: what counts as a fair comparison
Most on-site tools fire selectively, and that selectivity is exactly where the distortion occurs. A recommendation widget or chat assistant tends to activate on high-intent sessions: visitors who've browsed multiple pages, returned to the site a second time, or already added something to cart. If the control group being compared against is all sessions rather than that same high-intent segment, the tool will look far more powerful than it actually is, simply because it was never being compared to shoppers of equal buying intent in the first place.
This is the same distortion that appears in paid media studies, where research has found that 30 to 40% of attributed revenue at many DTC brands would have been generated organically regardless. Warm visitors buy at a higher rate whether or not a tool intervenes, and any test that doesn't control for that fact is measuring the audience, not the tool.
The fix is structural: treatment and holdout groups have to be drawn from the same underlying population. Same traffic source, same device type, same funnel stage. Only then does any difference in outcome become attributable to the tool rather than to who happened to land in each bucket. And this is precisely why vendor-reported lift numbers deserve skepticism by default. A tool vendor's own analytics will count every post-interaction purchase as influenced, with no mechanism for asking whether the shopper would have bought anyway. That's not a matter of bad faith; it's a structural conflict built into how the dashboard is designed to report. Ad platforms have been found to collectively claim 214% of actual revenue, an inflation dynamic that maps directly onto how on-site tools report lift once attribution stands in for causal testing.
Honest reporting looks specific rather than impressive. Lift stated with a confidence interval, a clearly defined holdout population, and a revenue comparison built off the brand's own baseline, not an industry benchmark and not a number pulled from the vendor's case study page.
Running the test: practical execution from launch to read-out
Before launch, four things need to be locked down. Confirm the tool can actually be toggled at the session or user level without degrading the experience for holdout visitors, since a broken holdout experience introduces its own bias. Lock the assignment logic before traffic starts flowing; changing it mid-flight invalidates everything collected up to that point. Write down the primary metric and the success threshold before the test starts, so results get read against a target set in advance rather than reverse-engineered to justify whatever number comes out. And document the promotional calendar for the test window in advance. A sale that lands mid-test isn't a disaster if it's planned for, but it is a disaster if it's discovered during the read-out.
During the test, resist the urge to peek and optimize. Early reads are noisy by nature, and stopping a test the moment it looks good inflates the false positive rate substantially. Watch for contamination daily in the first few days, specifically checking whether the holdout group is somehow seeing the tool anyway. A holdout that isn't holding out isn't a holdout. And track volume, not just rate: if the segment under test is too small, the right move is extending the window, not calling a winner off insufficient data.
At read-out, the math is straightforward: incremental revenue equals the difference between treatment conversion rate and holdout conversion rate, multiplied by treatment session count, multiplied by average order value. State the confidence interval alongside it. A lift number with no uncertainty bound attached isn't an actionable result, it's a guess dressed up as a finding. Segment by traffic source and device, because a tool that only moves the needle on mobile paid traffic is a fundamentally different product than one that lifts conversion broadly, even if the headline lift number looks identical. And when a test finds no significant lift, report that. A well-designed test that finds nothing is a valid, useful result. It is not a failure that needs to be run again until the number turns positive.
None of this is a one-time exercise. Incrementality shifts as seasonality, competitive spend, and the tool itself change, so a single test is a snapshot of a specific moment, not a permanent verdict. Most credible measurement programs re-test quarterly, or immediately after a significant product change.
On-site AI tools complicate measurement
AI-driven tools introduce a problem paid media testing never had to deal with: the tool itself can change mid-test. If the model underlying a chat assistant or recommendation engine is learning from live interactions, the "treatment" a shopper sees in week one of the test isn't the same treatment a shopper sees in week six. That's a moving target, and comparing a moving target against a static holdout produces a result that's hard to interpret cleanly.
Conversational tools add a further wrinkle. A shopper who asks three questions and then buys has walked a genuinely different path than one who ignored the chat window entirely, and separating engagement-driven lift from simple selection bias, where only the shoppers already inclined to buy chose to engage with the tool in the first place, requires holdout design built at the session level, not the interaction level. Testing at the interaction level will always overstate the tool's effect, because it never accounts for who chose to interact in the first place.
Catalog and discoverability tools raise a separate measurement gap entirely. Tools that enrich product data or optimize how a catalog surfaces in search affect discoverability before a shopper ever lands on the storefront. Measuring on-site conversion alone will undercount their real impact; a complete test needs to track assisted sessions from AI shopping surfaces like ChatGPT, Perplexity, and Google AI Mode all the way through to purchase, not just what happens after the click.
Agentic commerce complicates things further still. A buyer agent reading structured product data on a brand's behalf doesn't generate a "session" in any conventional analytics sense, which means existing on-site analytics may simply fail to capture agent-initiated purchases at all. Holdout design for agent-facing tools is a genuinely open problem right now, still awaiting a solution.
The practical fix for the model-drift issue: freeze the model version for the duration of the test window. A tool that's actively learning from treatment-group interactions cannot be cleanly compared to a holdout that received no tool exposure whatsoever, since the treatment itself was never held constant. On the catalog side, structured and enriched product data is what gets a brand cited by AI shopping surfaces in the first place, and that's testable: update a subset of SKUs with richer structured data, leave an equivalent subset untouched, and measure AI-referred traffic and conversion lift across the two groups.
Tools that support on-site and cross-channel incrementality testing for DTC brands
Not every brand needs a dedicated platform for this. The right tool depends on testing frequency, traffic volume, and whether the goal is a one-off validation or an ongoing discipline.
For Shopify brands testing on-site features specifically, Intelligems is purpose-built for the job: pricing, shipping, and site content tests that launch in under 15 minutes, AI Recommendations that surface what to test next, and an AI Visual Builder that accepts text, images, PDFs, and inspiration photos to build tests without a developer. It's available on all plans and connects to Claude, ChatGPT, and Gemini through an MCP server.
For brands running incrementality as an ongoing, cross-channel practice, the field is more crowded. Measured, rated 4.9 out of 5 on G2 and 4.8 out of 5 on Capterra, automates geo-testing, multi-tactic experiments, and causal marketing mix modeling integration, and is trusted by hundreds of enterprise brands; onboarding runs 2 to 4 weeks, and late 2025 brought on-demand model refresh and user-selectable inputs for real-time scenario planning. It's built for mid-market to enterprise, and may be more machinery than a small brand needs.
Haus, rated 4.5 out of 5 on G2, started as a geo-experimentation-first platform and has since expanded into causal marketing mix modeling and causal attribution. Setup is fast, and it suits lean DTC teams that want a low-overhead way to run frequent tests and sanity-check platform signals, though it isn't a replacement for day-to-day attribution reporting.
Recast, not yet rated on G2, combines marketing mix modeling with incrementality testing and leans less on pixel-level tracking than most competitors. In September 2025 it launched GeoLift, a separate geo lift testing product that can be used to manually calibrate the mix model's channel contribution estimates, though the two products don't share an automatic calibration loop yet. Recast needs meaningful historical spend data to produce a reliable output, which makes it a poor fit for younger brands.
Rockerbox, rated 4.6 out of 5 on both G2 and Capterra, is positioned specifically for DTC and e-commerce brands that want agile, in-platform incrementality testing combined with multi-touch attribution. Onboarding runs 6 to 8 weeks, and it carries particularly strong support for offline channels: CTV, linear TV, direct mail, podcasts.
Northbeam offers geo testing built directly into a broader attribution platform, giving a unified view for brands already using Northbeam elsewhere. It's not a lightweight standalone tool. Pricing runs tiered, from roughly $1,000 to $1,500 a month for the Starter tier, around $2,500 a month for Professional, with Enterprise requiring a custom quote.
Brands not yet ready to pay for a dedicated platform have real options too. Google Ads Conversion Lift carries no additional tool cost, though it requires a minimum $5,000 campaign budget and access to a Google account rep, and it measures Google-only incrementality with no cross-channel view. Meta Conversion Lift is free and built into Ads Manager; April 2025 brought Incremental Attribution to Ads Manager, an AI-driven feature that filters out organic sales, though the structural ceiling remains: it only measures what Meta itself can see. And a manual geo-holdout run in a spreadsheet costs nothing but internal time, with no automated significance testing, which makes it a reasonable way for a smaller brand to validate whether paying for a platform is even warranted yet.
An independent evaluation of vendors in this space, conducted by Sellforte using Claude and ChatGPT scored against public sources on September 8 to 9, 2026, across 31 criteria in 7 categories, ranked Sellforte at 25.0 out of 32, Lifesight at 18.0, Measured at 15.0, Haus at 13.3, Recast at 12.3, LiftLab at 12.0, Analytic Partners at 8.5, and Meridian GeoX at 5.8. Haus received the highest individual score for experiment recommendations and insights. Sellforte designed and published this evaluation and is itself one of the vendors under assessment, so the ranking should be read with that in mind.
General budget guidance from these sources holds up: brands spending under $30,000 to $50,000 a month on ads should start with free native tools or a manual test before paying for a platform at all. And for brands that want incrementality folded directly into budget allocation recommendations rather than delivered as a standalone lift number, Prescient AI is built for that specific use case.
There is a related structural point. An on-site AI trained on a brand's own catalog, policies, reviews, and voice, deployed consistently across the storefront and across AI shopping channels, generates structured interaction data as a byproduct of normal operation. That structure is what makes holdout design cleaner in the first place: every conversation logged against a session becomes usable evidence in the incrementality read-out, rather than disappearing into a vague bucket labeled "AI-influenced" purchases.
Reading results honestly and deciding what to do next
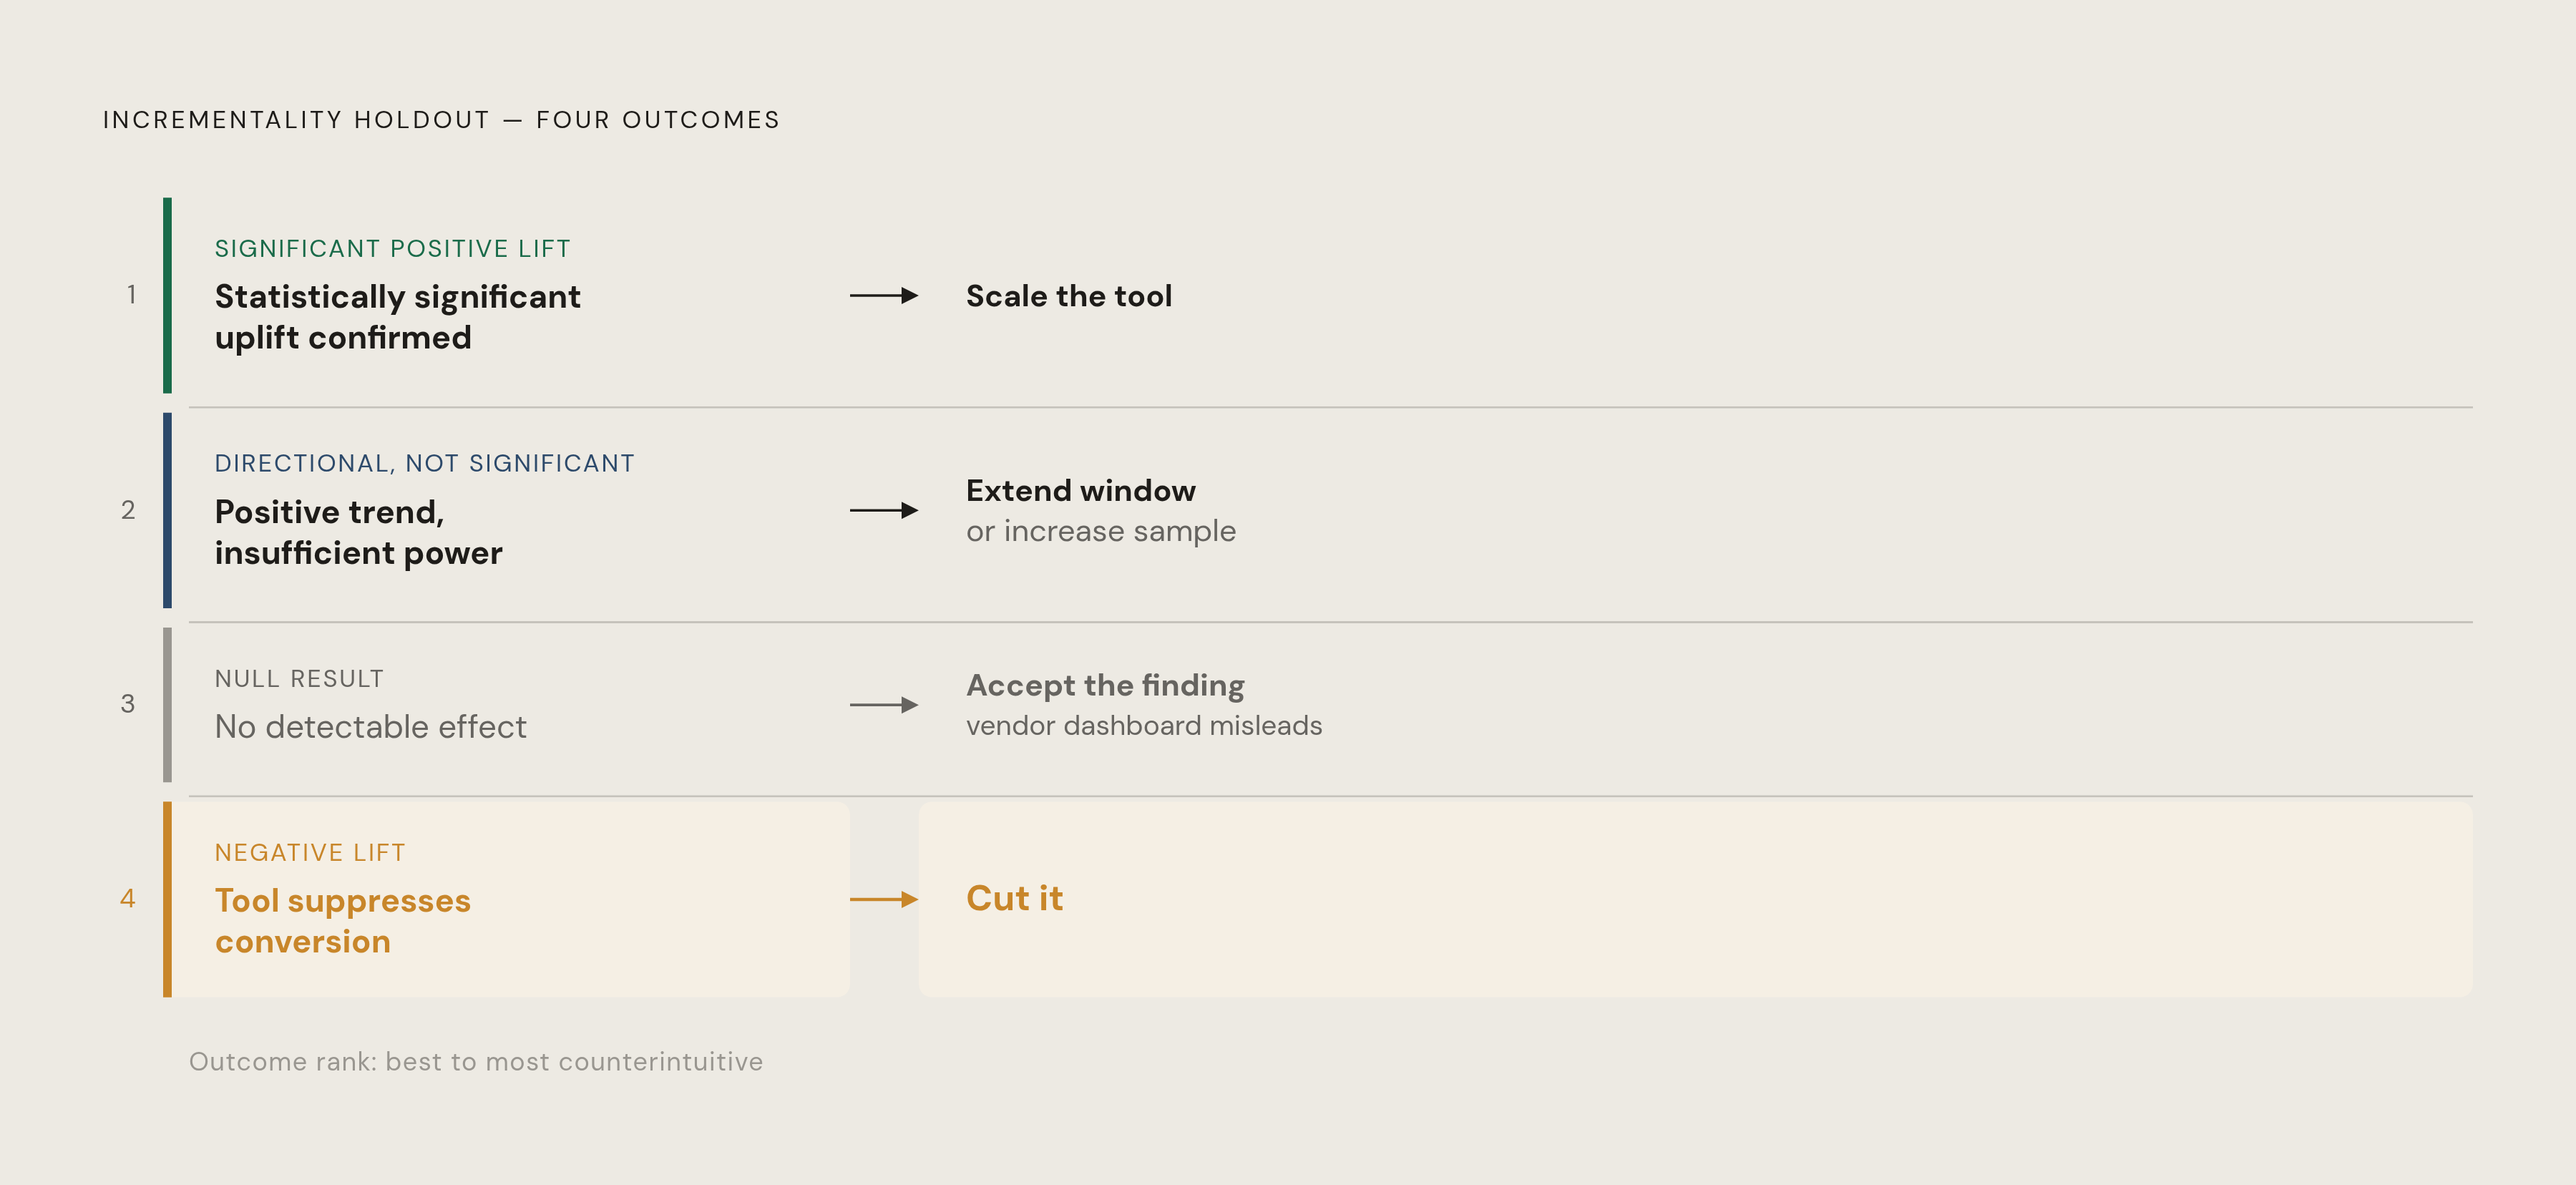
A well-run test produces one of four outcomes, and each demands a different response. Significant positive lift, with a confidence interval that holds up, means the tool earns its keep and the case for scaling it can be made on the numbers. Directional but not statistically significant lift means the test was underpowered or too short, and the right move is extending the window or increasing the sample, not declaring victory on a number that hasn't cleared the bar. A null result, no measurable difference between treatment and holdout, means the tool isn't doing what the vendor dashboard claims, and that's a legitimate finding, not a reason to keep testing until the answer changes. And negative lift, where the holdout group actually outperforms the treatment group, means the tool is actively getting in the way of shoppers who would otherwise have converted, which happens more often than most vendor pitches would suggest, particularly with popups and intrusive chat prompts that interrupt intent rather than support it.
The discipline that matters most here isn't statistical, it's behavioral. Brands that skipped incrementality testing for paid media for years, trusting platform dashboards because they were convenient, eventually paid for that trust in wasted spend. On-site tools are following the identical arc right now, just a few years behind, and the dashboards making the claims are built by the same vendors with the same incentive to show lift. Skepticism that took years to earn in the paid-media world should transfer to the storefront immediately, not after another cycle of inflated numbers gets discovered the hard way.