LTV Calculation Methods and Where DTC Brands Get Them Wrong
DTC brands systematically overstate customer lifetime value by five compounding mistakes.

A founder pulls up a slide with a lifetime value number on it, and that number is almost always wrong in the same direction: too high, for reasons that have nothing to do with sloppy math. Most DTC brands quote an LTV figure that is really a revenue figure wearing a profitability costume, and the inflation gets built in long before anyone sits down to do the arithmetic. In the Marlow Botanics example, the founder's slide shows an all-time revenue figure blended across every cohort the brand has ever acquired, while the number an operator can actually use is a 12-month cohort margin LTV, roughly a third of the vanity figure. Only the second number can be set against a customer acquisition cost and tell anyone anything true. Five choices drive that gap, each one compounding the error of the one before it: using revenue instead of contribution margin, dropping any time window, blending cohorts into a single average, borrowing a benchmark ratio built for SaaS, and treating LTV as something the retention program produces. The rest of this piece works through each one, in the order the error compounds.
Mistake one: building LTV on revenue instead of contribution margin
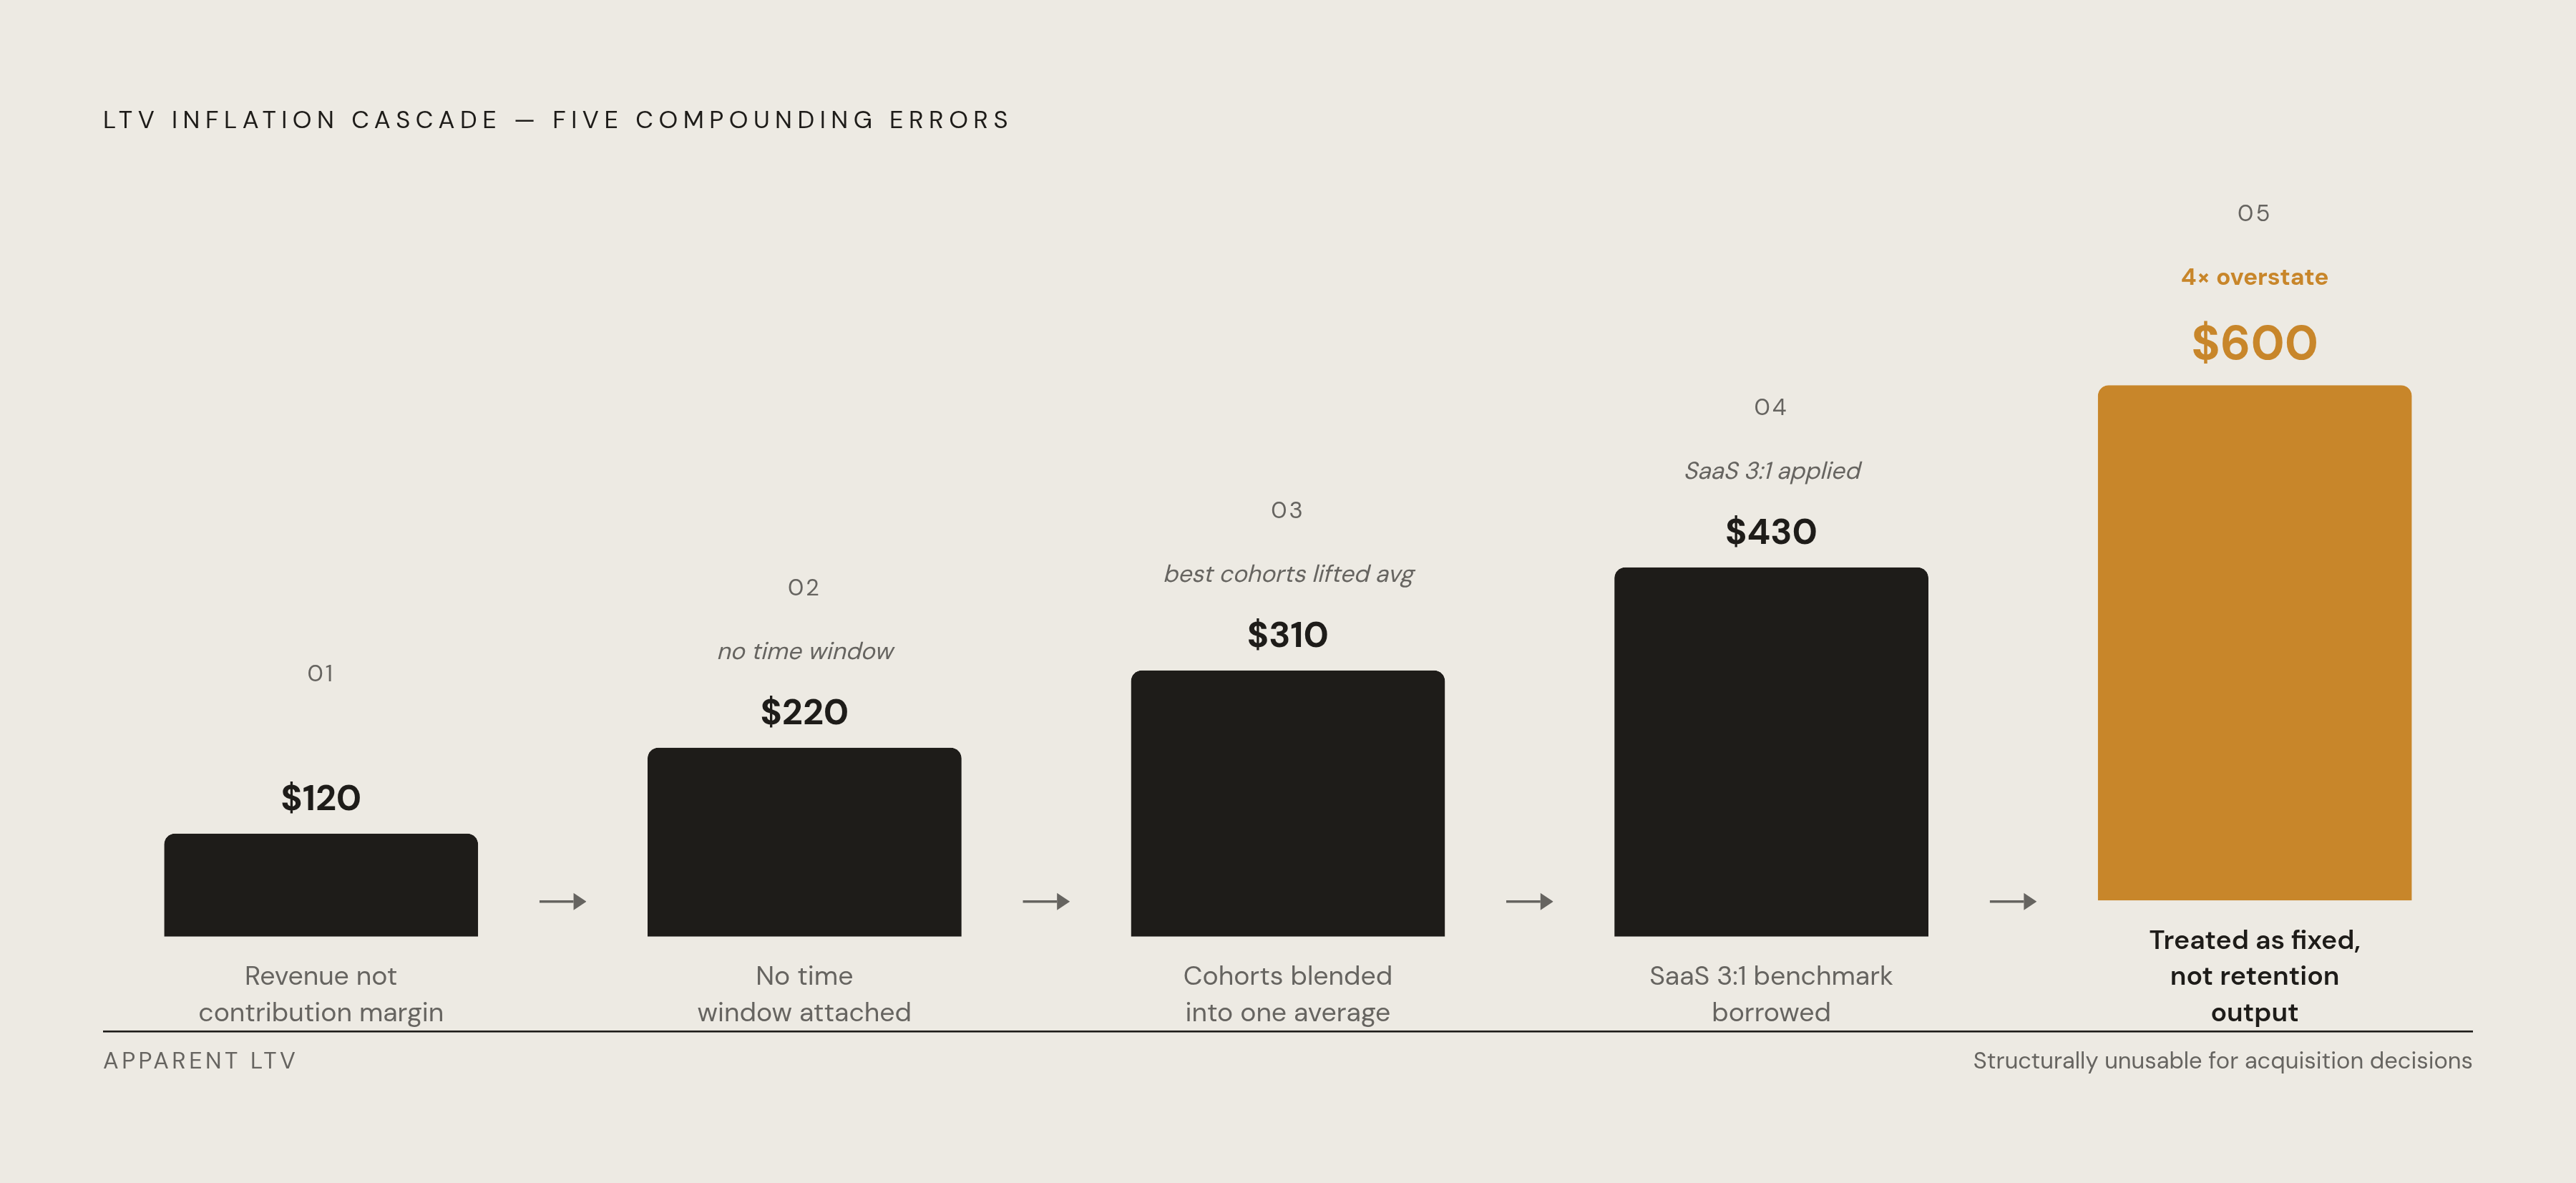
Contribution-margin LTV isn't a tighter version of revenue LTV. It answers a different question entirely, and a brand that makes acquisition decisions on the wrong answer bleeds cash in a way that only appears in the books much later. Revenue LTV asks how much a customer spends. Contribution-margin LTV asks how much of that spending the brand actually keeps after the cost of goods sold, discounts, returns, shipping, fulfillment, and payment processing fees are taken out. That second figure, applied as a margin percentage to average order value and multiplied through the lifetime formula (AOV times orders per year times years retained times contribution margin percent), is the only version a board or a media buyer should ever act on.
Revenue-based LTV overstates the usable number by a factor of one divided by the brand's contribution margin. A brand running a 40% contribution margin that reports revenue LTV is quoting a figure more than twice what it can actually put toward paid acquisition. Most DTC brands build LTV on revenue instead of margin, and that single substitution can overstate customer profitability by 50% or more depending on the category's margin structure.
The mechanism that breaks is the CAC ceiling. A brand setting its maximum acceptable acquisition cost off a revenue-based LTV is bidding against money it will never actually collect: once fulfillment costs come out, the margin left over can't cover the acquisition spend the inflated number just approved. The exposure is worst in apparel and beauty, where return rates run high and gross-revenue LTV ignores returns completely. Net revenue after returns has to be the starting point before any margin percentage gets applied, or the whole calculation is fiction dressed as a spreadsheet.
Mistake two: quoting LTV with no time window attached
An LTV number with no time window attached avoids the question of whether the current acquisition strategy pays for itself, because it mixes customers acquired at different costs, in different markets, under different retention conditions, into one number that describes no actual cohort. A brand that has been selling for five years and reports "lifetime" value across all five years is really reporting a blend of its best year and its worst year, with no way to tell which one is driving the figure.
The fix is a cap: 12 months for most categories, extending to 24 months for considered purchases where the sales cycle runs longer. Revenue that arrives in year three doesn't help pay this quarter's ad bill, and a CAC decision made today has to be funded by money the brand can reasonably expect within a bounded, near-term window.
A second trap compounds the missing window: estimating customer lifespan by dividing only among the customers who came back, rather than the full cohort including the ones who never returned. Doing the division that way is automatically optimistic, because it drops the churned customers out of the denominator and lets the survivors carry the average. This lifespan estimate, and therefore the LTV built on it, looks healthier than the actual cohort ever was.
Mistake three: blending cohorts into a single average that hides retention decay
Blending cohorts into one average LTV is the most operationally dangerous mistake on this list, because it's the one most likely to be doing damage while looking perfectly fine on the dashboard. A blended average is a weighted average of cohorts at different stages of maturity, and for a brand that's still growing, rising top-line revenue can mask a retention curve that quietly deteriorates for months before the damage appears in cash flow.
Cohort-based measurement solves this by tracking each acquisition month's customers separately and watching how their spending curve behaves over time. A healthy curve flattens and holds at a stable floor. A curve that keeps declining toward zero without ever flattening belongs to a one-and-done brand, one where customers buy once and don't come back, no matter what the blended average says.
None of this requires custom-built tooling. Shopify's cohort analysis report groups customers by first order date and tracks their retention automatically from inside the standard Shopify Analytics dashboard. Klaviyo's customer lifetime value reporting builds a CLV model from a brand's own order data and retrains it at least once a week. A pivot table on a raw order export does the same job by hand. The discipline of running this view monthly, on margin-adjusted numbers rather than raw revenue, matters far more than the tool used.
Blending appears most sharply in brands with mixed subscriber and one-time buyer bases, where some customers subscribe and others churn after a single purchase, producing a blended average that describes neither group accurately, so any bidding decision built on that average will be wrong for both segments at once. Beyond subscriber status, the segments worth calculating separately are acquisition channel and first-product category. One more segment deserves a flag here, even if it's a thread this piece picks back up later: brands seeing any traffic referred by AI tools should track that cohort separately, because folding it into the general average can hide a customer segment with structurally different economics from the rest of the file.
Mistake four: applying the SaaS 3:1 LTV:CAC rule to a business with a fundamentally different cash profile
The 3:1 LTV:CAC rule did not come from ecommerce. It comes from SaaS, where LTV is gross-margin-adjusted revenue collected across a multi-year subscription with predictable, slow churn. Applying that ratio to a DTC brand whose customers buy once or twice sets a target that does one of two bad things: it either validates a brand whose underlying economics are actually broken, or it fails a healthy brand simply because it operates in a low-margin category where a 3:1 ratio was never realistic to begin with.
A healthier benchmark for DTC ecommerce runs between 2.5:1 and 4:1, measured on a 12-month verified-cohort basis, with LTV built from contribution margin. What ratio is achievable, and what it actually means, depends heavily on the category's margin structure. A luxury brand with high margins and a high CAC can sustain something closer to 5:1, though sitting at that upper boundary risks under-investing in acquisition even while the unit economics are structurally sound. A CPG brand running lower margins and a lower average order value at 2.5:1 may already be structurally stretched at scale, since fulfillment and cost of goods consume most of the revenue before anything reaches the bottom line.
Subscription DTC is the one segment that genuinely behaves more like SaaS, because locked-in replenishment cycles make retention predictable in a way one-off purchases never are. That predictability lets a subscription brand defensibly sustain a higher CAC than a non-subscription brand in the same category, but that has to be modeled explicitly rather than assumed just because the brand uses a subscription model. Order count, not loyalty or brand strength, is doing the work.
The ratio also carries a timing assumption that almost never gets stated out loud: it's only valid when compared against new-customer CAC, not a blended CAC that folds in the cost of reactivating existing customers. Reactivating a lapsed customer costs much less than acquiring a new one, and blending that cheaper reactivation cost into the CAC denominator flatters the ratio without actually improving the brand's new-customer economics. A brand burning cash could show an LTV:CAC ratio that looked perfectly healthy on a long enough time horizon while still running out of money, because the ratio alone says nothing about how fast that return arrives. CAC payback period is the cash-flow complement the ratio is missing: the ratio tells a brand what it gets back, and the payback period tells it how long the wait is before that return reaches the bank as cash.
Mistake five: treating LTV as a fixed property of the customer rather than the output of the retention programme
LTV is the output of everything the brand does after the purchase rather than a trait attached to the customer at the moment of acquisition, and treating it as fixed means the retention program has no feedback loop telling it whether it's working. Four levers move LTV, and all four sit downstream of acquisition: purchase frequency, which is the biggest lever available; average order value, through upsell and cross-sell; churn reduction; and gross margin improvement.
The frequency lever makes the case for treating LTV as something a brand actively manages. A brand that moves customers from 2 orders per year to 3 orders per year raises LTV by 50% without spending another dollar on acquisition. Improve annual retention on top of that and the gain compounds further, again with no added acquisition spend. That's the kind of improvement a brand can plan for and measure, because it comes from decisions made inside the retention program, separate from the acquisition channel mix.
One distinction matters before any of this gets reported upward: historic LTV and predictive LTV are not interchangeable. Historic LTV, what customers have already spent, is accurate because it's backward-looking, and it's the right number for reporting and for building VIP tiers. Predictive LTV estimates future spend and is the number a brand should actually target and budget against, once the data behind it is clean: stale orders removed, gross margin calculated net of returns, subscription billing reconciled. Marketing tools that extrapolate from speculative future purchases commonly produce predicted LTV scores running well above what the cohort actually delivers. Those predictive scores belong in segmentation and trigger logic, not in the number handed to investors or used to set a CAC ceiling.
DTC's LTV distributions are right-skewed: a small number of high-value customers pulls the mean well above the median. An acquisition strategy built to match the mean is really built to match a handful of whales, not the customer the brand is actually going to acquire at scale. The median customer, not the mean, is the bar an acquisition strategy has to clear. If LTV is the output of the retention program rather than a fixed property of whoever walks through the door, then improving it is a systems problem, something to be diagnosed and rebuilt, not a number to be recalculated once a quarter. But that diagnosis only works once the first four mistakes, revenue in place of margin, no time window, blended cohorts, and a borrowed SaaS benchmark, have already been removed from the number being diagnosed.