AOV Decomposition for Merchandising Decisions
Breaking down AOV into units, price, and discounts reveals which team should fix what.

An operator opens the dashboard and finds average order value down from the period before. The number offers no explanation of itself. It does not say whether shoppers bought fewer items, whether they traded down to cheaper products, or whether a coupon code leaked further than intended. It just reports the damage, and whoever is staring at it is left guessing at a fix with no evidence to support the guess.
The arithmetic behind the number is sound: total revenue divided by total orders, nothing to dispute there. What it hides is distribution. A handful of high-value orders can pull the mean well above the bracket where most orders actually sit, which makes the store look healthier than it is for the typical shopper, and it's why Shopify's own guidance recommends studying mean, median, and mode together rather than reacting to the headline figure alone. A single average can rise even as the typical transaction shrinks, and nothing in the number itself will flag the discrepancy.
AOV sits at an organizational seam. AOV sits at the intersection of three teams: merchandising sets the product surface, pricing sets the unit economics, and marketing controls discount distribution. None of those teams owns the aggregate figure, so when it moves, there's no clear desk to walk it to. A merchandising lead can point to pricing, pricing can point to marketing, and marketing can point back to merchandising, and the number keeps moving while the argument about ownership continues.
The stakes of getting this right are not cosmetic. Revenue in e-commerce runs on three multiplicative levers: traffic, conversion rate, and AOV. A lift in AOV carries the same top-line effect as an equal-percentage lift in traffic or conversion, and it's typically cheaper to produce, since it works on shoppers who have already decided to buy rather than shoppers who still need to be found and persuaded. Treating AOV as a single opaque number squanders the cheapest of the three levers precisely where a few hours of correct diagnosis could pay for itself many times over.
The three-node metric tree that makes AOV actionable
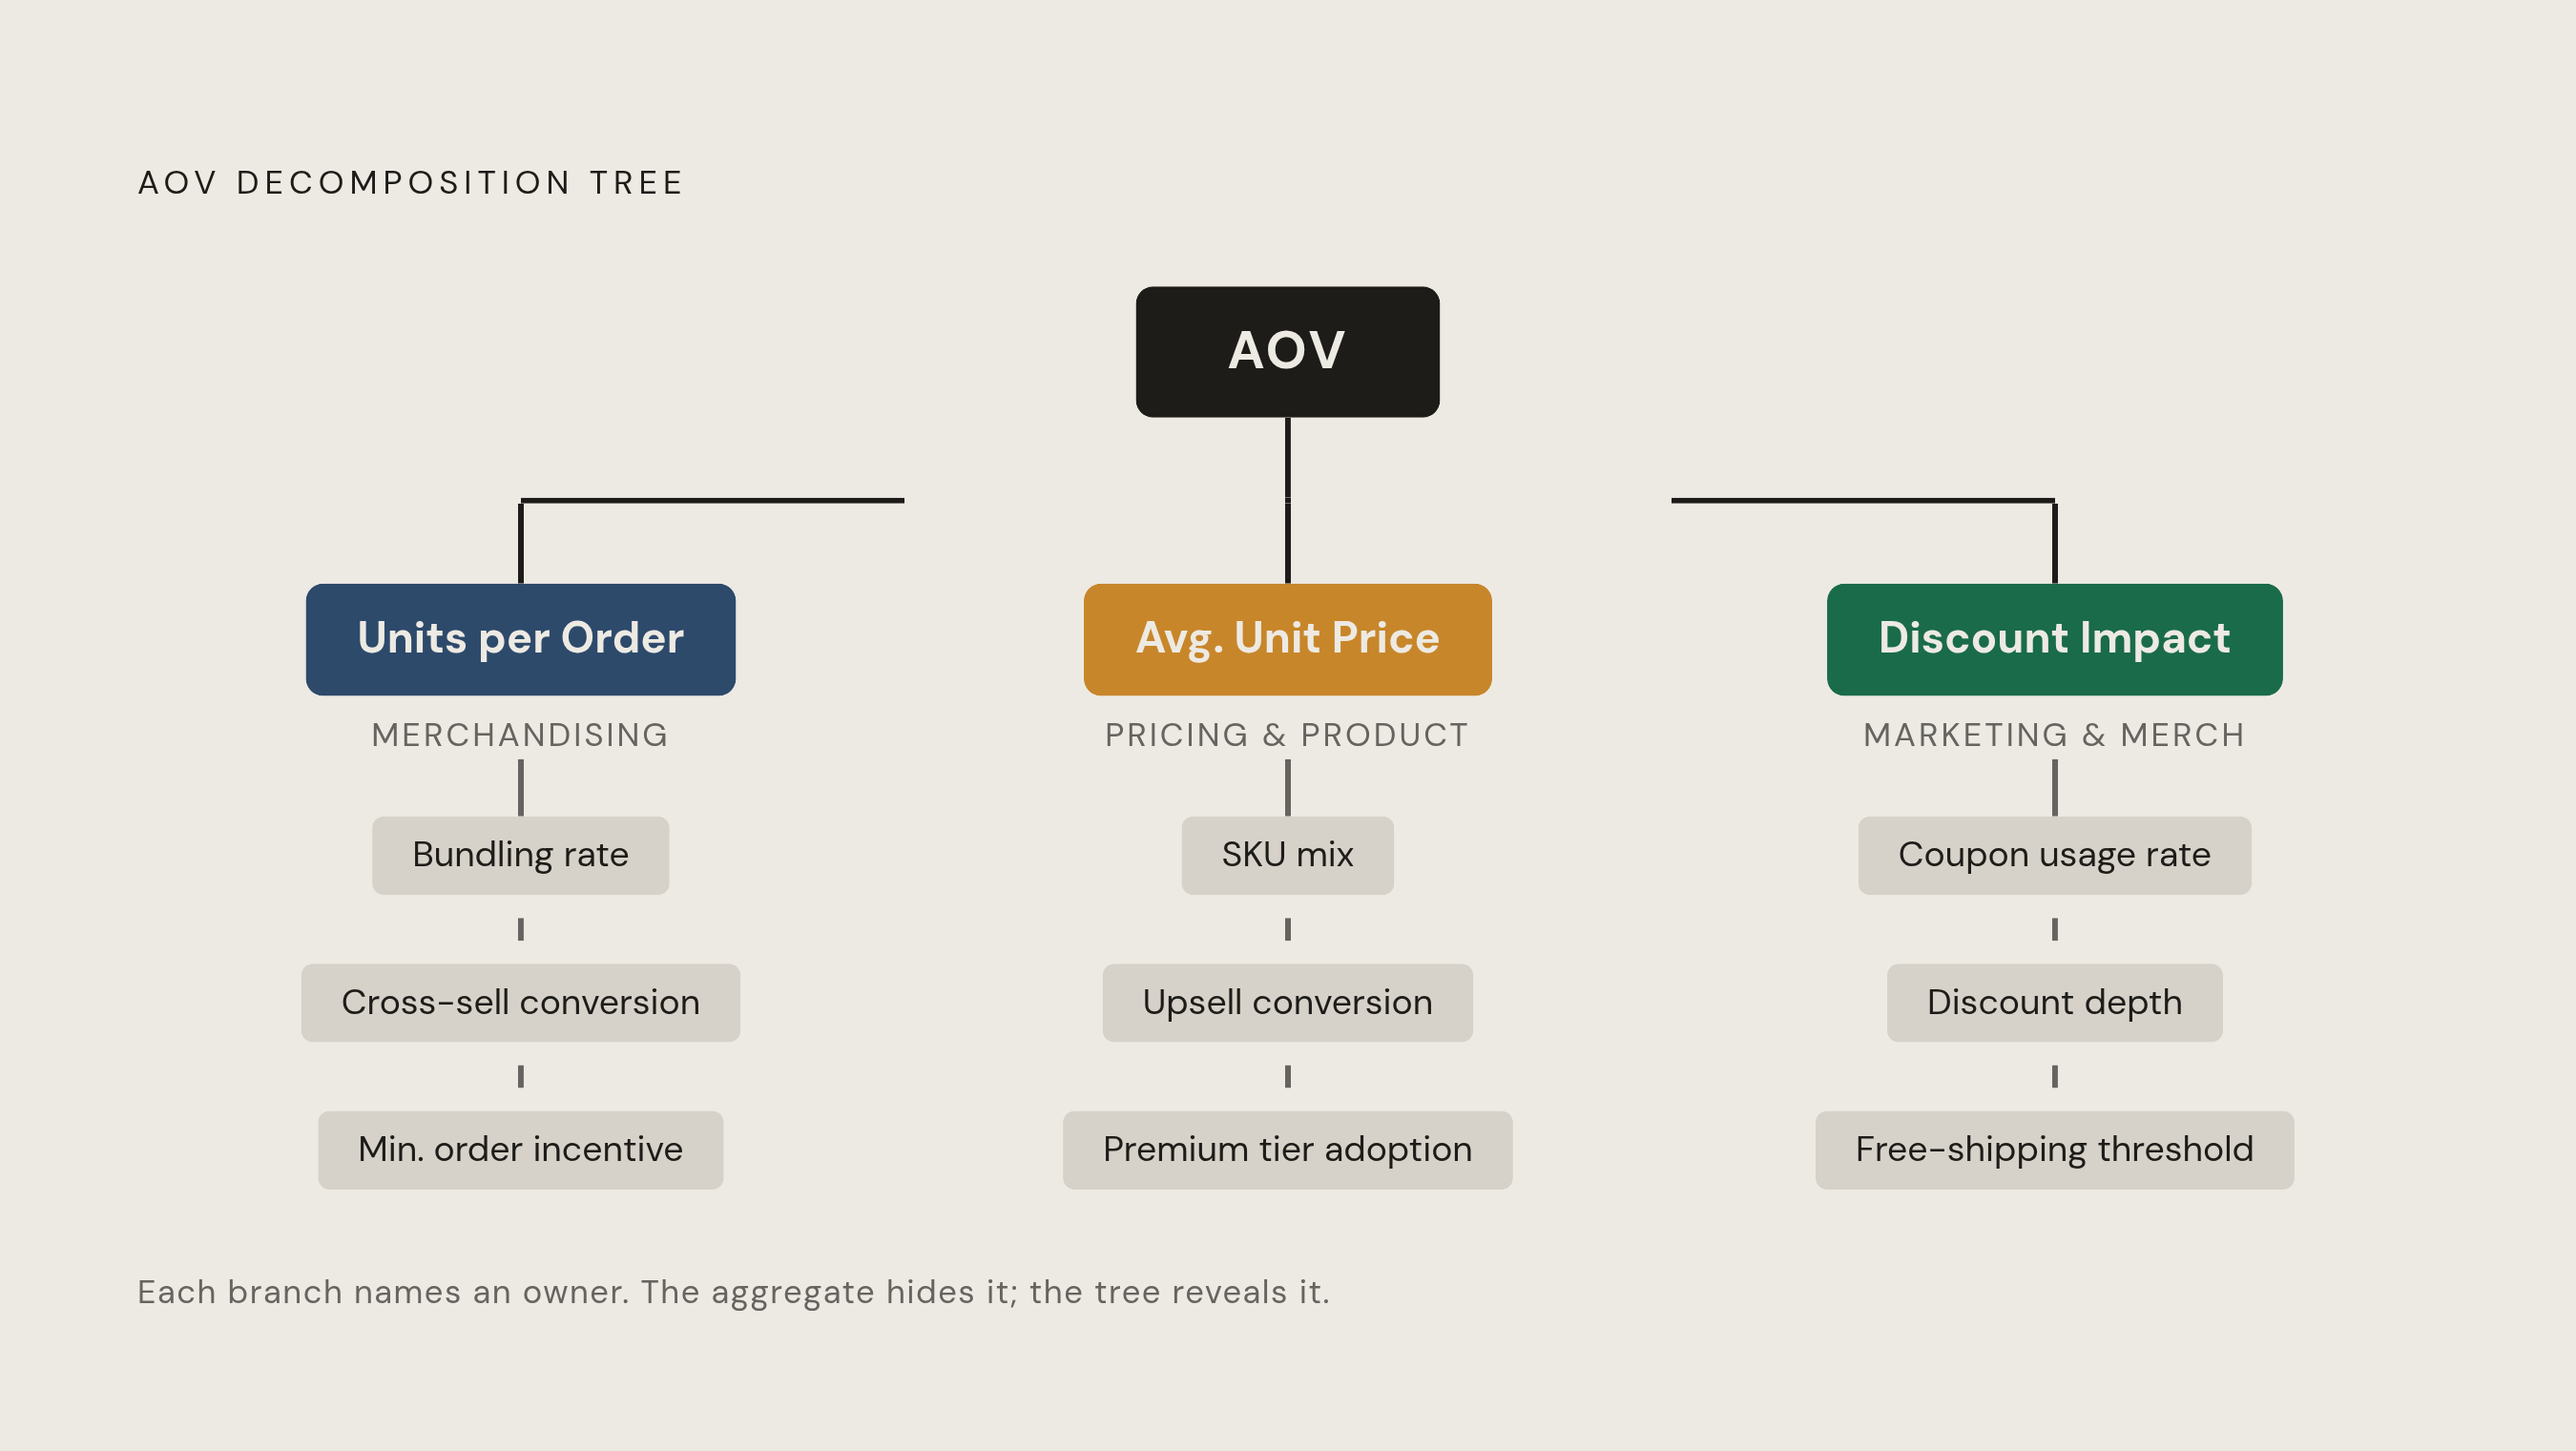
The way out of the single-number trap is decomposition. AOV breaks into exactly three nodes: units per order, average unit price, and discount impact, and each one is ownable by a specific team and points toward a specific class of fix. Units per order tracks how many items land in a typical basket, and it rolls up from product bundling rate, cross-sell conversion, and minimum order incentive uptake. Average unit price tracks what each of those items costs on average, and it rolls up from product mix between high- and low-price SKUs, upsell conversion rate, and premium tier adoption. Discount impact tracks how much of the gross transaction value gets given back before it reaches the top line, and it rolls up from coupon usage rate, average discount depth, and the free shipping threshold effect.
The value of drawing the tree this way is that each branch belongs to someone. Merchandising controls units per order through what gets surfaced and bundled. Pricing and product control average unit price through what gets built and what gets promoted to a premium tier. Marketing and merchandising together control discount impact, marketing through promotional reach and targeting, merchandising through discount depth and which products are eligible. None of that ownership is visible in the single number; all of it is visible the moment the number is decomposed.
That visibility changes the nature of the conversation a falling AOV produces. A generic mandate to "raise AOV" gives three different teams three different, mutually exclusive ideas about what to do, and all three might be defensible in isolation while working against each other in practice. A tree that identifies which node actually moved turns that mandate into something specific: a conversation with the owner of that node, about the intervention that node supports. The tree is the decision architecture that tells an organization who should be in the room when AOV changes, and that is the condition the rest of this piece works from.
How to read a movement in units per order and what to do about it
When units per order is the node that falls, the cause is almost always a merchandising failure: the storefront has stopped giving the shopper a credible reason to add a second item. Confirming that starts with isolation. Filter orders by item count across the period in question. If the share of single-item orders is climbing while multi-item orders hold flat or decline, units per order is the node doing the damage, and the next step is to check cross-sell conversion rate and bundling uptake independently. If both have slipped at the same time, the issue is how the next item is being presented.
Check whether average unit price is quietly rising at the same time before committing to this diagnosis. Separate from AOV-driven mix shifts: a rising average unit price can mask a simultaneous decline in units per order, making the composite look stable while the basket is quietly shrinking in depth. Two nodes moving in opposite directions can cancel each other out in the aggregate number, which is exactly the kind of blind spot decomposition exists to catch.
Once units per order is confirmed as the driver, the interventions belong squarely to merchandising. Bundling complementary SKUs at a modest discount lifts the item count without touching unit price at all, and it works: fragrance brand WHO IS ELIJAH lifted AOV by nearly half during BFCM 2024 after rolling out tiered gift-with-purchase rules on Shopify. Placement matters as much as the offer itself. Recommendations on the product detail page and in the cart both outperform post-purchase recommendations for reach and traffic volume, and even though post-purchase recommendations can post higher acceptance rates, only the pre-purchase placements can actually raise units within the same order, since a post-purchase recommendation applies to a transaction that has already closed. Minimum order incentives round out the toolkit: free shipping thresholds function as a units-per-order lever because a large majority of U.S. shoppers say they'll add an extra item specifically to clear the threshold, pulling a second or third item into the cart without requiring a discount on anything. Each of these moves the same node for the same reason: it gives the shopper a low-friction reason to add rather than asking them to reconsider the whole purchase, which is the job that belongs to merchandising and nobody else.
How to read a movement in average unit price and what to do about it
When average unit price is the node that falls, the most common cause is a mix shift, shoppers gravitating toward lower-price SKUs, and not a pricing error at all. This is the trickiest node to diagnose correctly, because the instinct when average unit price drops is to reach for the price lever, and that instinct is usually wrong.
Isolating the cause starts with a revenue-weighted average selling price calculation by SKU cohort across two periods. If lower-price SKUs are capturing a larger share of unit volume, average unit price will fall even though no individual price changed. The next step separates two problems that look identical in the aggregate. If the same SKUs are selling at lower effective prices than before, that's a pricing or discount problem, properly handled in the discount impact node. If the SKU mix itself has shifted downmarket, that's an average unit price problem owned by product and merchandising. A third check belongs here too: premium tier adoption. If upsell conversion from a base SKU to a higher-tier variant has declined, the fault may sit in presentation, with the premium option not surfaced at the moment the shopper is deciding.
The interventions that follow are structural rather than promotional. Static "Newest Arrivals" sorting prioritizes inventory age over conversion probability, which buries high-margin SKUs under unproven new ones. Reordering collection pages to surface high-price, high-margin products to high-intent sessions lifts average unit price directly. Upsell presentation matters for the same reason it mattered in units per order: surfacing the premium tier at the point of item selection, on the product page rather than after add-to-cart, catches the decision before the shopper has anchored on the cheaper option. And if a brand's own navigation routes most traffic into lower-price categories by default, average unit price will keep falling no matter how well any individual upsell performs. The fix there is architectural, a rebuilt navigation path, not a new promotion. Ownership of this node sits with pricing and product, who decide which SKUs and tiers exist, while merchandising executes by deciding which of those get surface prominence.
How to read a movement in discount impact and what to do about it
When discount impact is the node that's growing, rising coupon usage or deepening average discount depth is suppressing AOV even while units per order and average unit price stay healthy, and the instinctive response, adding more promotions to compensate, tends to make the underlying problem worse. This is an argument for measuring what a given round of discounting is actually doing to the basket before reaching for another one, not an argument against discounting as a tool.
Diagnosis starts by separating discounted from non-discounted orders and calculating AOV independently for each cohort; if discounted-order AOV is falling while non-discounted-order AOV holds, the problem is discount depth, not basket composition. From there, check coupon distribution: a code performing far above its expected share of discounted orders has likely leaked beyond the audience it was built for. And check the free shipping threshold, because a threshold set too close to the median order value can act as a ceiling instead of a floor, giving shoppers a reason to stop adding items the moment they clear it rather than a reason to keep building the basket.
The corrective moves here are specific. Tightening coupon distribution, moving from broadly shared codes to single-use, audience-specific codes, closes the leak without requiring any change to the promotional calendar. Raising minimum spend thresholds for discount eligibility turns the discount from a price-reduction tool into a basket-building tool: redemption still happens, but it happens on baskets large enough that the discount supports AOV instead of undercutting it. Underneath this sits a harder judgment call: distinguishing shoppers who have been trained onto discount cycles from shoppers who were always going to buy at full price. That distinction calls for a controlled pullback in discount frequency rather than a deeper discount, but it requires honest cohort analysis before anyone acts on the assumption.
The diagnosis gets harder because the attribution feeding these decisions is often unreliable in the same direction. Platform-reported revenue tends to inflate the apparent success of promotional spend. Common Thread Collective's geo-holdout test database finds the median incremental ROAS of Google branded search sits at a fraction of what the platform itself reports, and the same overlapping-attribution-window pattern shows up in discount-driven campaigns. A promotion can look like it drove the sale it merely happened to coincide with; the discount impact node is as vulnerable to bad measurement as it is to bad targeting.
Static merchandising rules and node diagnosis
The three-node tree is only as reliable as the data feeding each branch, and manual or rule-based merchandising systems corrupt that data systematically. They introduce a structural lag between what shoppers are actually doing in a given session and what the storefront shows them, and that lag mixes signal with noise at every node of the tree. Static rules underperform real-time intent engines by a substantial margin on revenue per visit, and the gap reflects a basic mismatch in speed: shopper intent shifts session to session, while human-managed merchandising decisions update on a weekly or monthly cadence at best.
The failure appears differently at each node. Manual cross-sell lists get set weekly or monthly, so a product driving strong bundle attachment this week may be out of stock or superseded by a new arrival before the rule gets updated, and the units-per-order data collected in the meantime reflects the stale rule rather than current shopper behavior. Static collection sort orders present the identical product mix to a first-time visitor arriving from a paid social ad and to a returning VIP, two shoppers with entirely different price sensitivity and intent, which corrupts the average unit price data generated by both of their sessions. Rule-based promotion triggers fire on session count or cart abandonment signals rather than on actual price sensitivity, so discounts frequently land on shoppers who would have bought at full price anyway, inflating discount impact without buying any incremental revenue in return. Manual tagging compounds the problem further by creating isolated data silos: when product data doesn't flow between recommendation surfaces, the units-per-order diagnosis is built on an incomplete picture of what shoppers were actually offered.
None of this is a failure of effort on the part of merchandising teams. It's a mismatch between the cadence those teams can realistically operate at and the cadence at which the data they need to read actually changes.
What adaptive merchandising surfaces that static rules cannot
Resolving the lag identified above means making storefront decisions at session-level speed rather than on a weekly or monthly schedule. The payoff is cleaner data at every node, which makes each of the diagnoses described above more trustworthy.
At the units-per-order node, AI recommendation systems match cross-sell and bundle options to the current session's browse pattern instead of pulling from a static list set days or weeks earlier. Automated product tagging combined with psychographic metadata captures session-level intent directly, which makes cross-sell conversion measurable in something close to real time rather than inferred after the fact. At the discount impact node, intent-based discount triggers reduce the rate at which discounts land on shoppers who were already prepared to pay full price, tightening the gap between discount depth and the incremental revenue it's meant to produce.
What changes across all three nodes is not the structure of the tree itself. The tree still has three branches, still assigns three owners, still demands the same diagnostic questions it demanded before. What changes is the reliability of the signal arriving at each branch, and a diagnosis built on session-accurate data will hold up to scrutiny in a way that a diagnosis built on a stale spreadsheet update never quite can.