Comparing Platform-Reported ROAS Across Meta, Google, and TikTok
Each platform measures ROAS differently, making their dashboards incomparable without adjustment.

Three dashboards, three different numbers, one finance meeting where somebody asks which one is real. Meta says 3.2x. TikTok says 1.6x. Google says 5.1x. The instinct is to treat these as competing scores on the same test, when they are, in fact, three different tests graded on three different curves reporting out under a shared label. Platform-reported ROAS across Meta, Google, and TikTok isn't a common metric with varying results, it's three distinct measurements dressed up in the same terminology.
The mismatch starts with how each platform decides what counts as a sale it gets to claim. Meta's default window runs 7-day click and 1-day view. Google runs last-click with a 30-day window for Search. TikTok runs click windows of varying lengths plus something it calls an "engaged view," which credits a conversion to a user who watched a set minimum of an ad and then bought within a follow-on window the advertiser configures. Three different clocks, three different triggers, all producing a number labeled "ROAS" that lands on the same slide.
Some of these windows look identical without measuring the same thing. Meta's 7-day click window and TikTok's 7-day click window share a name and a number, but the underlying event definitions, what counts as a click, what counts as a view, don't match. A 7-day window built on one definition of a click isn't measuring the same behavior as a 7-day window built on another.
None of this happens because a platform is malfunctioning or gaming the numbers dishonestly. Each one reports faithfully according to its own internal rules, and those rules exist to make that platform look as effective as possible to the advertiser paying for space inside it, not to hand a brand a clean, comparable view of its marketing across every channel it uses. Meta has no obligation to tell you what TikTok already claimed. TikTok has no reason to defer to Google's version of the story. Every platform is arguing its own case, and every dashboard is an exhibit in that argument, not a neutral referee.
Attribution windows and credit-claiming logic produce the gap between dashboards
The gap between what a dashboard reports and what actually lands in a bank account is the predictable output of three separate last-touch attribution systems running simultaneously on the same shopper's path to purchase.
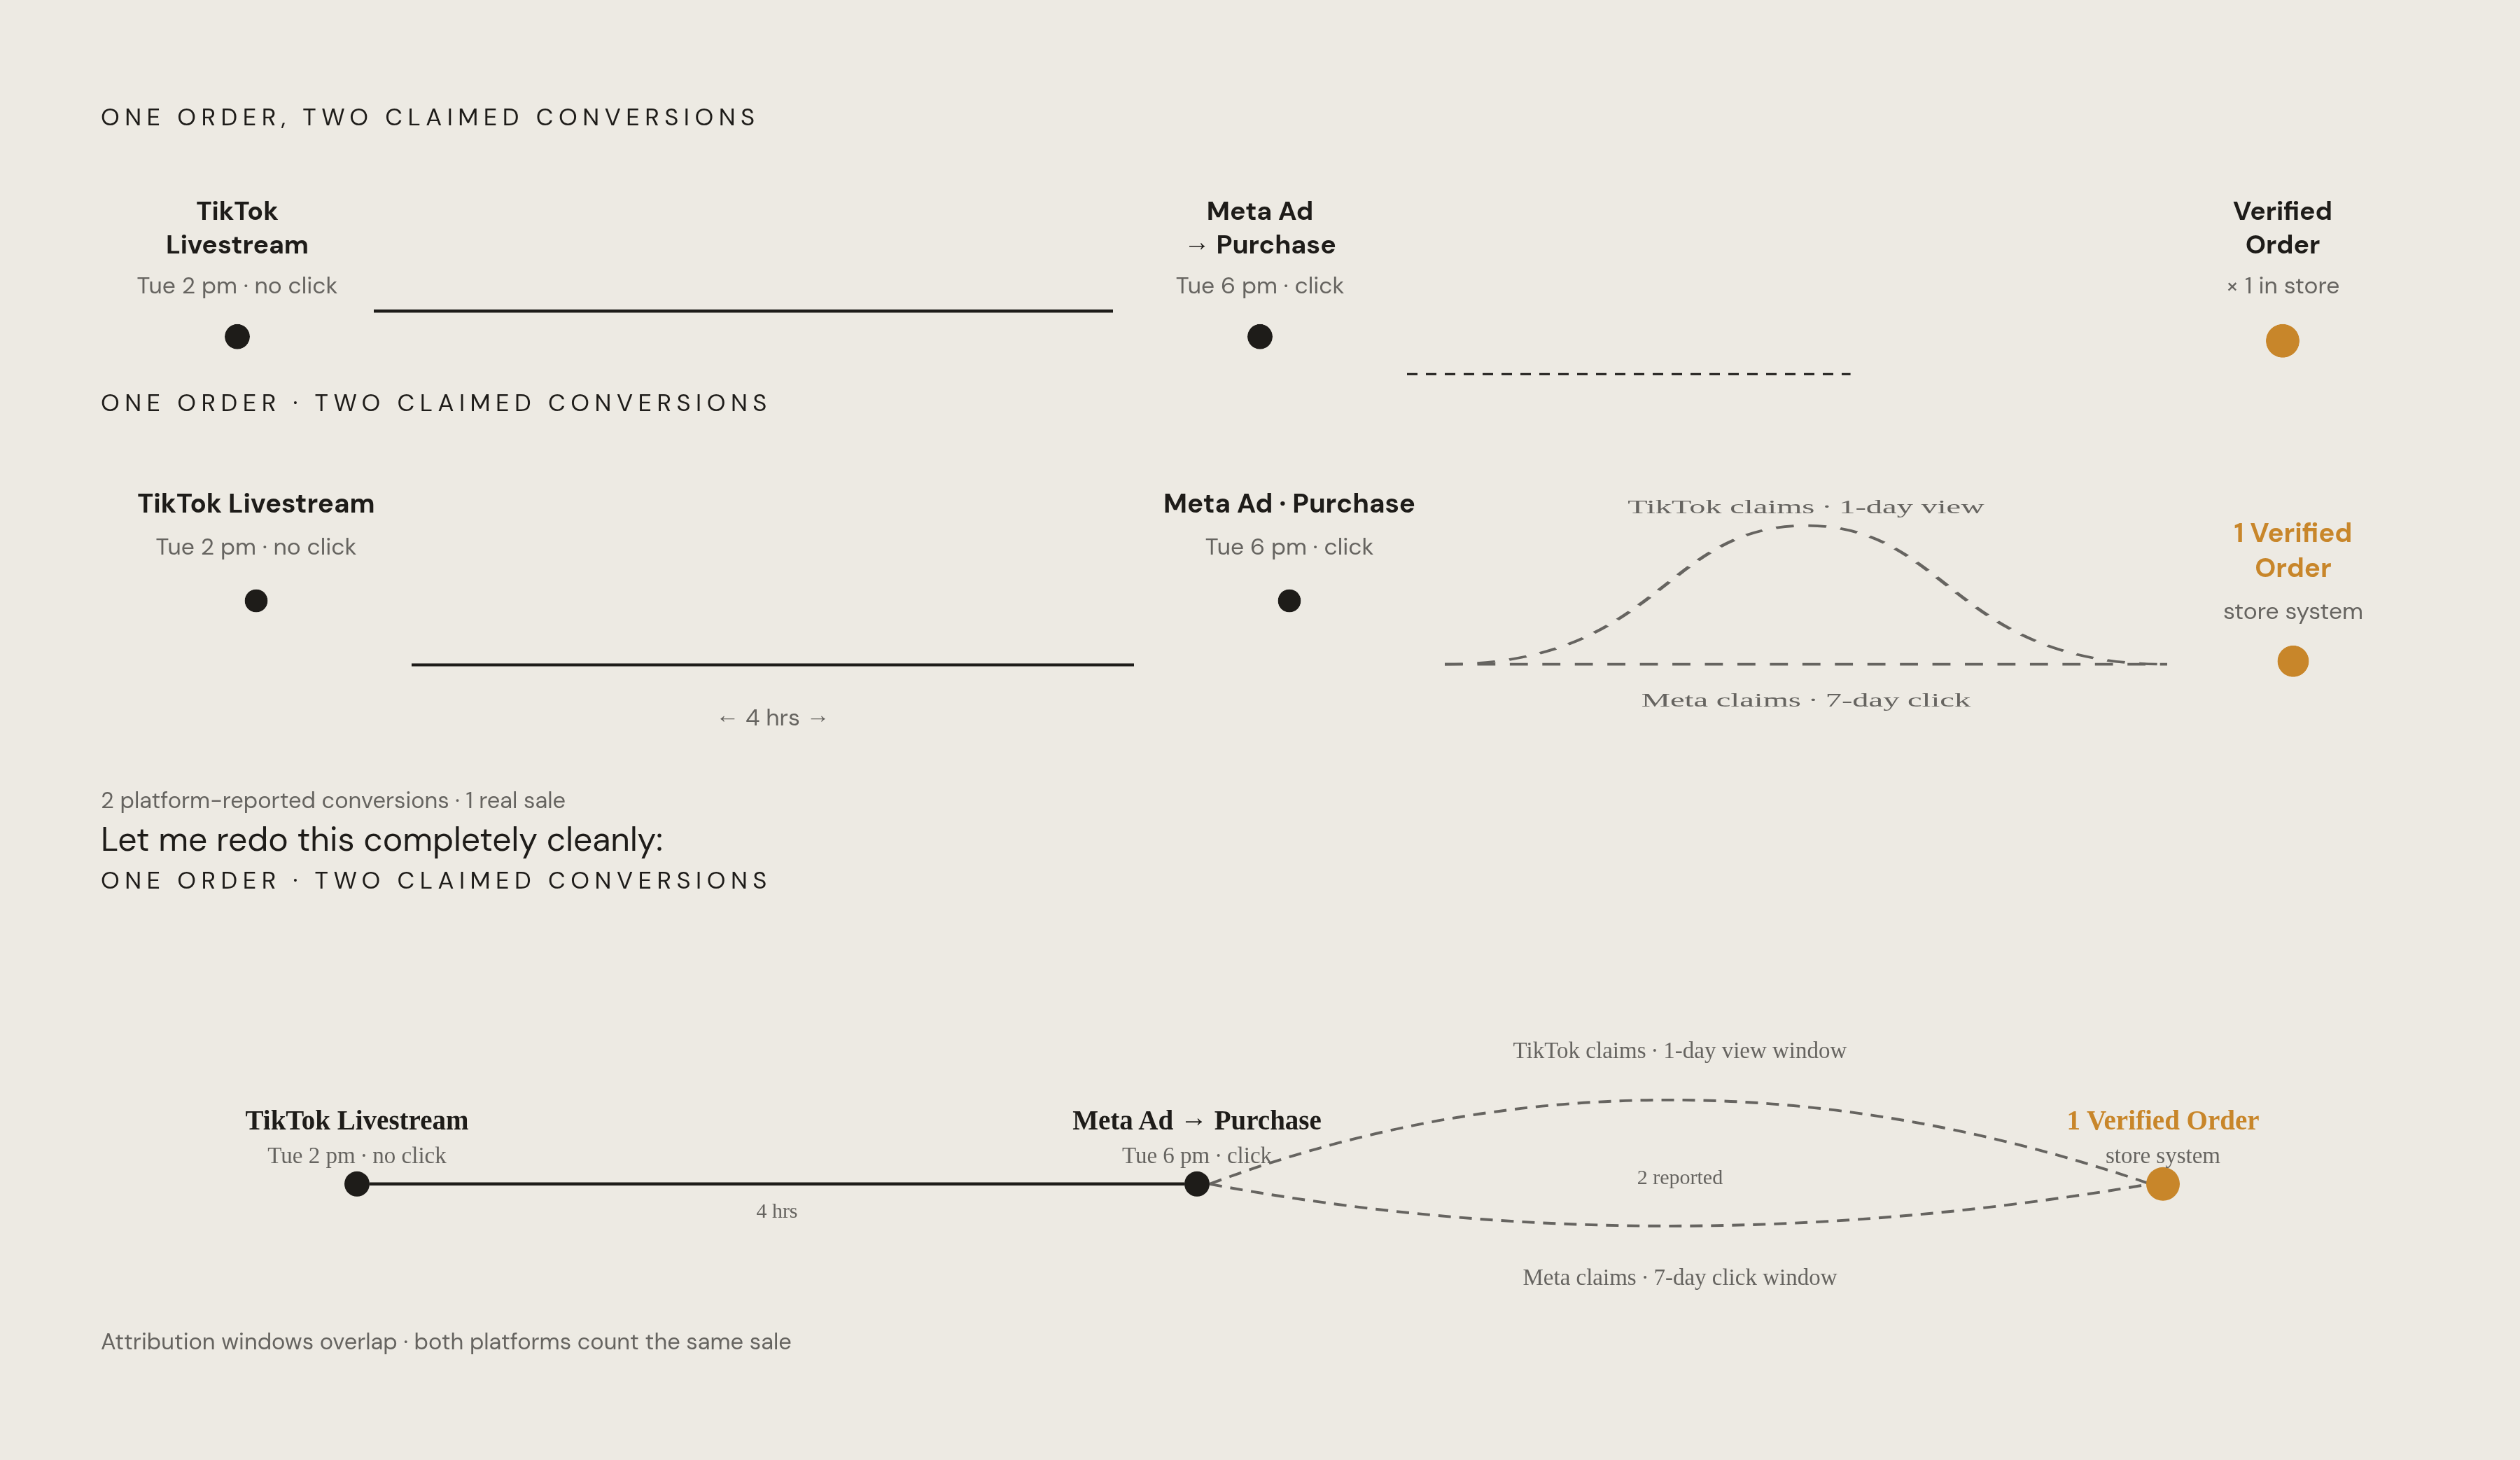
Trace one customer through a single day to see it happen. A shopper watches a TikTok Shop livestream on a Tuesday afternoon and doesn't click anything. A few hours later, a Meta retargeting ad shows up in her feed, she clicks it, and she buys. The store's order system logs exactly one sale. TikTok's system logs a conversion too, claiming it through the 1-day view window that covers her livestream viewing. Meta's system separately logs the same order as a conversion, claimed through its 7-day click window. One sale, recorded twice, by two platforms that have no visibility into each other's ledgers.
It runs the other way just as often. TikTok does the work of introducing the product and building the interest, and gets zero credit once Meta's last-click model closes the sale on the final touch. That asymmetry compounds at scale: media buyers tracking blended performance across TikTok and Meta together commonly find the combined ecosystem ROAS runs well above the simple sum of what each platform separately reports, because last-click logic hands the full sale to whichever platform touched the shopper last, regardless of whether another platform already claimed that same sale on its own separate ledger.
Google sits in a structurally different spot in this same story, and its position tends to flatter its own numbers without any change in actual performance. A meaningful share of Google's branded search conversions come from shoppers who had already made up their minds before they typed anything into a search bar. They saw a Meta ad or watched a TikTok video, decided the product was worth buying, then Googled the brand name to find the checkout page. Google claims that conversion in full, even though the consideration work that actually persuaded the shopper happened somewhere else. Google Search occupies the close of the funnel, catching intent that Meta and TikTok generated further upstream, so comparing their ROAS figures side by side without adjusting for that funnel position resembles comparing a closer's win rate to a prospector's hit rate on cold leads.
TikTok absorbs the opposite penalty. Its reported number tends to understate its real influence precisely because it operates earlier in the journey than either Meta or Google. Brands that pause TikTok spend to test its actual contribution routinely see branded search volume drop on Google and Meta's retargeting pools shrink, evidence that TikTok was generating demand that converted somewhere else and was never credited back to the platform that created it.
The 2026 rule changes that made an already broken comparison worse
None of this sat still through 2026. Meta, Google, and TikTok each rewrote their own rules within months of one another, and every single change moved the number on a dashboard without moving a real dollar of revenue anywhere in the business.
Meta went first. On January 12, 2026, the platform permanently retired its 7-day view and 28-day view attribution windows, leaving 7-day click plus 1-day view as the only default left standing. Meta also redefined what counts as a click in March 2026, a change that moves the denominator of every ROAS calculation running through the platform without a single additional sale actually occurring.
Google followed in April, shifting its default attribution model. Google's reported ROAS figures from before that April change are not directly comparable to its figures after it, even inside one account, under one login, tracking one set of campaigns.
TikTok's contribution to the mess is less a single rule change than a structural one that keeps getting bigger. The platform continues splitting its reporting between Shop orders and website conversions, and TikTok Shop's own sales during BFCM 2025 topped $500 million across four days alone. As TikTok Shop's gross merchandise volume keeps scaling, the Shop-vs.-website reporting split creates an additional layer of incomparability that didn't exist at this scale before.
None of these changes is indefensible on its own. Each platform can point to a reasonable product or measurement rationale for what it did. Stacked together, though, they mean a brand comparing Q1 2026 ROAS to Q4 2025 ROAS, or comparing Meta's number to TikTok's number at any point this year, is comparing figures generated under meaningfully different rules, not under a stable, shared standard that happened to produce different outcomes.
The gap this produces doesn't stay constant either. It widens under load. During high-traffic periods like BFCM, both TikTok and Meta keep running last-touch attribution models that can't see past their own platform walls, and higher traffic simply feeds more overlapping shopper journeys into that same blind spot for double-counting. Any brand that hasn't revisited its measurement setup since late 2025 is running its media plan on assumptions that the platforms themselves have already made obsolete.
Before fixing any of this, it helps to look at what the actual benchmark numbers floating around the industry are, and aren't, telling anyone.
What the benchmark ROAS figures across Meta, Google, and TikTok reflect
Benchmark numbers exist and answer a narrower question than most marketers assume they answer. They don't rank platforms by quality. They describe funnel position, and the gap between them reflects where each platform sits in the customer's decision.
Meta's ecommerce ROAS, based on 2025 data, runs low-to-mid single digits for most brands, with figures around 2.2x cited at the lower end for campaigns focused on new customer acquisition specifically. These numbers vary meaningfully across different sources, largely because they reflect different campaign mixes, different measurement windows, and different points in time, and the attribution window issue covered above accounts for a real portion of that spread.
TikTok's benchmark range tells a similar story in miniature, at the category level rather than the platform level. Industry data shows a wide gap between TikTok's best-performing product categories and its weakest ones, and that spread isn't evidence that TikTok works for some brands and fails others as a channel. It reflects category-specific attribution gaps and differences in where each category's typical customer sits in the funnel when TikTok reaches them.
This raises the obvious objection: if a brand's Meta ROAS consistently beats its TikTok ROAS, why not just shift the whole budget to Meta? The answer sits in everything the two prior sections already established. Meta's number benefits from picking up TikTok's uncredited discovery work through last-click retargeting, and TikTok's number gets punished for generating demand that another platform later claims. Cutting TikTok on the strength of a platform-reported comparison risks cutting the very channel responsible for a chunk of the demand Meta is converting.
Treat the ranges above as reference points. None of these figures can be stacked against one another in good faith without first putting every platform on the same attribution rules, because right now, they simply aren't running on the same rules. Fixing that is the actual work.
Building a measurement framework that produces numbers the finance team can believe
The fix is building a reconciliation process anchored to a source of truth no platform controls: actual verified orders sitting in the store's own order system.
Standardize attribution windows across every platform before making any comparison. A shopper who watches a TikTok Shop live on Tuesday with no click, then clicks a Meta retargeting ad hours later and buys, generates one sale that TikTok claims through its 1-day view window and Meta claims through its 7-day click window, so two platforms report two conversions for one order. Pick a single window and apply it uniformly across every platform in the stack. Pair that with a second standardization: judge every platform on click-only attribution and drop view-through credit. Disputed view-through claims are where most of the double-counting described earlier actually lives, and holding every platform to the same click-based rule removes the argument before it starts.
Deduplicate at the order level next, not the platform level. A single verified order in Shopify, BigCommerce, or WooCommerce should get counted once, full stop, no matter how many ad platforms each want a piece of the credit for it. That means matching every TikTok-claimed conversion and every Meta-claimed conversion back to a real order ID sitting in the store's own system, not accepting either platform's claim at face value.
Once the window is standardized and the orders are deduplicated, bring in marketing efficiency ratio, or MER, as the bridge between what marketing reports and what finance actually needs to see. MER is simply total revenue divided by total marketing spend. It carries no channel-specific attribution logic inside it, so no platform's overlapping claims can inflate it the way they inflate individual ROAS figures. The number appears on the P&L regardless of which platform argues it deserves the credit. TikTok in particular tends to look stronger through this lens than its own platform ROAS suggests, because a meaningful share of its impact appears as organic lift and repeat purchases that last-click attribution never captures.
Finally, bring in an independent third-party measurement layer to settle disputes the internal reconciliation process can't fully resolve on its own. Northbeam's Clicks + Deterministic Views model, developed directly with Meta, TikTok, Snapchat, Pinterest, Axon, MNTN, and Vibe, ties verified first-party transaction data to both clicks and ad views through a clean room environment. Brands that had previously seen YouTube or CTV show low attributed ROAS despite obvious demand impact now have a more complete picture of what those channels are contributing.
None of these four steps works in isolation. Standardized windows without order-level deduplication still let two platforms claim the same sale inside the same time frame. Deduplication without MER still leaves finance guessing at what the blended number actually means for the P&L. The combination is what turns three platforms arguing their own case into a single number a finance team can actually plan around, and it's the only version of "ROAS" worth trusting once you understand how the other three got built.