Triangulating Attribution Signals Across Three Measurement Methods
Three measurement methods reveal where traditional ROAS math gets it catastrophically wrong.

Per-channel ROAS overstates true return by roughly 2.3x layerfive.com. That single figure explains why so many DTC budget meetings end in an argument nobody can resolve with data everyone claims to trust. The US DTC ecommerce market hit $212.9 billion in 2025, accounting for 19.2% of all retail ecommerce, and at that scale, measurement error translates directly into misallocated budgets ringly.io.
The dysfunction starts with how each platform counts. When a shopper sees a Meta ad, then later clicks a Google search ad and buys, Meta claims full credit for the sale, and so does Google. Both platforms are telling the truth, technically, and both numbers are wrong.
Apple's iOS 26 update, which landed in September 2025, tightened signal loss even further embertribe.com. Median DTC contribution margin fell from 35% in 2021 to 22% in 2025 as paid acquisition got more expensive layerfive.com. That decline is the actual cost of acting on inflated attribution signals in an environment where every dollar of spend already buys less than it used to.
None of the three measurement methods brands rely on today was built to solve this whole problem. Each was built to serve a platform's own reporting interest, or to answer one narrow analytical question. Triangulating them is the foundation "real" attribution depends on. The core dysfunction: Meta, Google, and email each run their own attribution windows and models, so aggregate attributed revenue from all platforms almost always exceeds actual store revenue, per jetfuel.agency. CPM inflation compounds the problem: a brand paying $8 CPM on Instagram in 2019 now pays $20 to $30 CPM for comparable placement, per tyb.xyz eco.com. Customer acquisition costs have risen 222% over the past eight years, and this is the environment in which inflated attribution causes the most damage ringly.io layerfive.com.
What each of the three methods measures.
Multi-touch attribution models conversion paths from data observed at the user level. Media mix modeling infers channel contribution from historical spend and revenue patterns, without needing to track individual users. Incrementality testing establishes causation through controlled experiments. Three different questions, three different data requirements, three different blind spots.
MTA operates at the level of the individual buyer: it tracks sessions across channels and assigns fractional credit according to whichever model a brand has chosen. Its strength is granularity, campaign-level and ad-level detail, delivered close to real time, which makes it genuinely useful for daily tactical calls. A 2025 Haus industry survey found only 39% of marketers named MTA their most-trusted measurement solution, a sign of how far confidence has shifted toward causal methods weareqry.com. Vendors are racing to patch the gap. Northbeam launched a Clicks + Deterministic Views model in late 2025, built in direct partnership with Meta, TikTok, Snapchat, Pinterest, Axon, MNTN, and Vibe, specifically to recover signal lost to iOS restrictions. Triple Whale has taken MTA in a different direction, extending it into profit-based attribution that credits channels for actual profit after COGS, shipping, returns, and platform fees, not just top-line revenue.
MMM works from the opposite direction. It analyzes historical spend and revenue across channels to estimate contribution independent of last-click logic, and it doesn't need user-level tracking to do it. That makes it resilient to the privacy changes that keep eroding MTA, and it's the only one of the three methods that captures offline and hard-to-track channels well. In an EMARKETER and TransUnion survey, 27.6% of US marketers rated MMM the most reliable methodology of any single method, ahead of MTA at 19.4% and unified measurement at 18.9% admetrics.io. The tradeoff is speed and resolution: MMM runs on aggregated historical data, so it's slow to reflect what happened last week, and it has nothing to say about which specific ad or creative drove a specific sale. For any brand spending more than $50,000 a month, first-party data, MMM, and incrementality testing aren't optional extras anymore embertribe.com paz.ai. They're table stakes embertribe.com paz.ai.
Incrementality testing is the only method that establishes true causal lift from a channel, independent of whatever attribution model a brand happens to be running, through geo holdouts, ghost bids, or tools like Meta's Conversion Lift. It answers what MTA and MMM structurally cannot: would these sales have happened anyway, without the spend? That causal clarity comes at a cost. Incrementality works best as validation, checked periodically rather than as the primary real-time signal a brand checks every morning admetrics.io. Haus has recently pushed the category further with a Causal MMM product, which builds directly on its own experiment results, an early move toward fusing incrementality and MMM into a single platform.
That's not a coincidence, and it's the entire argument for running them together rather than picking a favorite. Incrementality Testing.
Running the three methods in parallel without creating three more silos
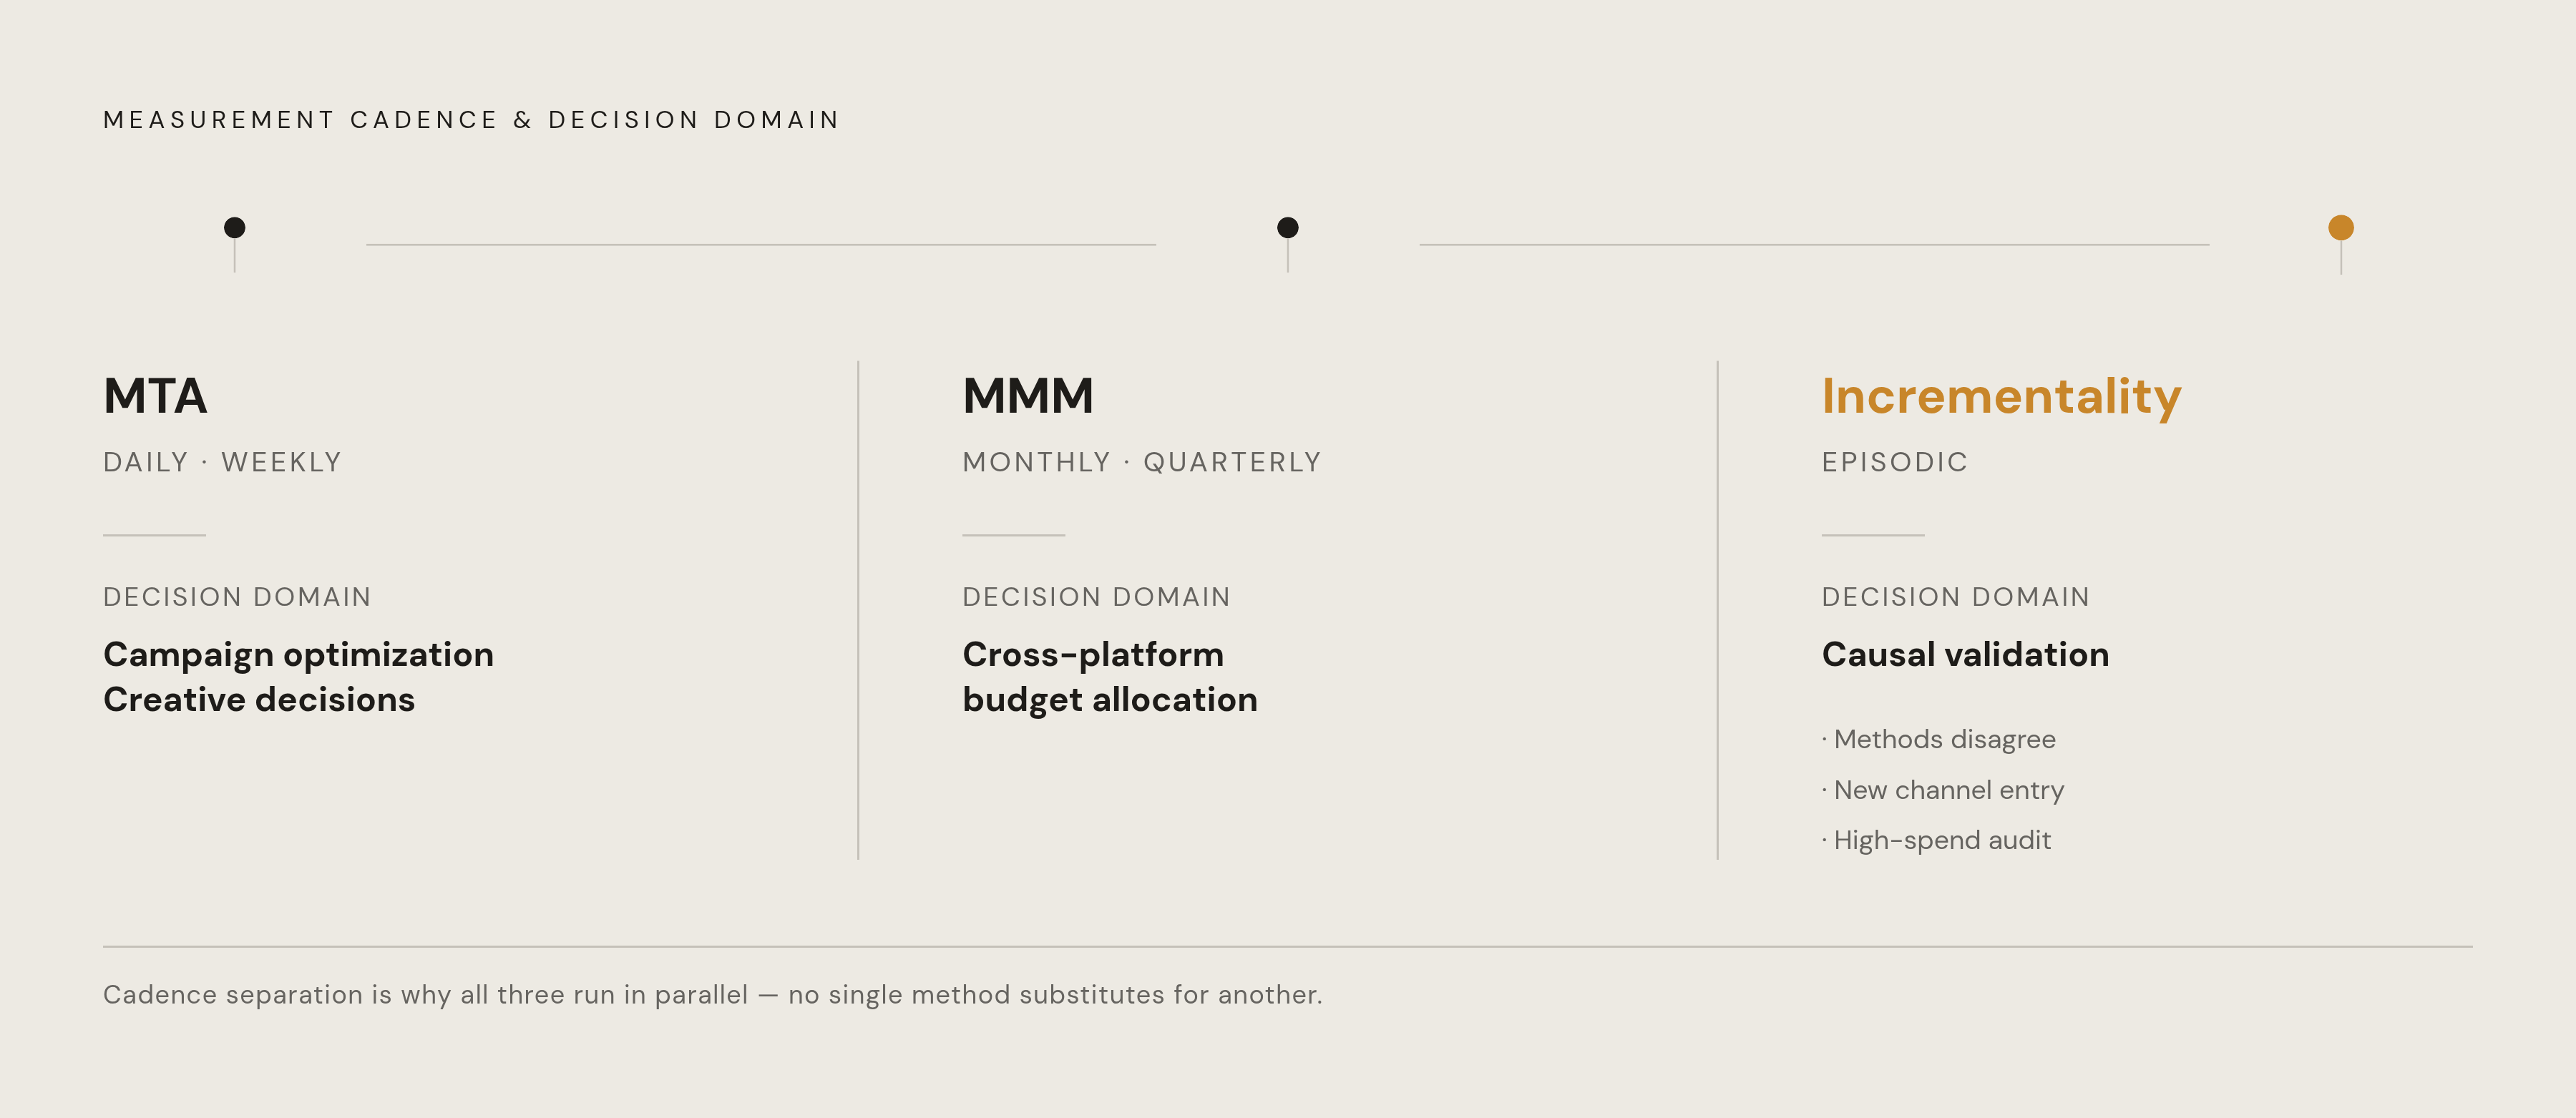
The consensus architecture, and it is a consensus rather than a novel proposal, assigns MTA to tactical daily decisions, MMM to strategic channel allocation, and incrementality to validation. Each method needs its own cadence and its own decision domain, or the three of them just become three separate arguments a brand has with itself.
MTA runs daily or weekly, feeding campaign optimization, creative decisions, and pacing within a channel. MMM runs monthly or quarterly, feeding decisions about how budget moves across platforms rather than within one. Incrementality runs episodically: when MTA and MMM disagree, when a brand enters a new channel, or when it's time to audit a channel that's absorbing a large share of spend. Trying to run all three on the same clock defeats the purpose. MMM literally cannot move faster than its input data allows, and forcing incrementality onto a weekly cadence just produces underpowered tests that mislead more than they clarify.
Each method also needs a different diet of data. MTA runs on first-party pixel data, server-side events, and post-purchase surveys, the kind Triple Whale runs natively inside Shopify, asking customers directly how they found the brand, which gives self-reported data to check against what the pixel says. MMM needs historical spend and revenue by channel, plus context on seasonality, promotions, and macro events that might be confounding the numbers. Incrementality needs geo-segmented sales data and hold-out control groups with enough order volume per region to produce a statistically sound result.
Tool choice tends to split by company size. Smaller, Shopify-focused brands tend toward Triple Whale, which starts at $129 a month, along with ThoughtMetric and Cometly, prioritizing fast setup and tight native integrations over deep customization cometly.com eco.com.
None of this matters, though, without a reconciliation protocol sitting on top of it. Buying three tools and running them without one produces three independent dashboards, each capable of supporting a different budget argument depending on which one gets pulled up in the meeting. The tools don't create alignment on their own; reading the gaps between them is where the actual value gets extracted. Mid-market and enterprise: SegmentStream, Northbeam, Rockerbox (deeper customization, stronger support for complex multi-channel environments); Rockerbox implementation takes 4–8 weeks due to offline data integration complexity, per improvado.io.
Reading agreement and divergence: what the gap between methods is telling you
Agreement is the cleanest signal triangulation produces. When MTA, MMM, and incrementality all point to the same channel as a top contributor, that convergence counts as strong evidence, not proof, but about as close to proof as current measurement gets. The same logic runs in reverse: when all three methods show a channel going flat, it is a channel a brand can cut without agonizing over it.
Divergence is where the real interpretive work happens, and it appears in a handful of recognizable patterns. The most common one: MTA credits a channel heavily, while incrementality shows little to no actual lift. That combination usually means the channel is capturing demand that would have converted anyway, branded search and retargeting are the classic offenders here, since a shopper clicking a retargeting ad was often already headed toward the checkout page regardless.
A second pattern: MMM credits a channel only modestly while MTA credits it heavily. That gap often means the channel benefited from seasonality or some correlated event that MMM is correctly separating out as a confound, while MTA, lacking that broader context, is absorbing the credit into the channel itself. A third: incrementality shows real lift, but both MMM and MTA undercount it. That's the signature of a channel that's actually working but is structurally hard to track, podcasts, out-of-home, influencer partnerships, the kind of media that doesn't leave a clean digital trail. This is precisely the case where incrementality's causal design earns its keep, because it's the only method built to catch a channel none of the tracking-dependent tools can see.
And when all three methods disagree with each other, the honest read usually points to a data quality problem, not a measurement problem: inconsistent UTM tagging, broken pixels, mismatched date windows between platforms. Before debating which model is right, check whether the inputs feeding all three are even describing the same events.
A deeper mental shift, one that Kroger Precision Marketing has pointed out, causes this: lower incremental ROAS often reflects more honest measurement, not worse performance. Operators trained on last-touch dashboards tend to read a lower number as bad news. Often it's just the first accurate number they've seen. Divergence between methods should trigger a test that resolves which dashboard to believe. The gap itself is information about how the channels actually behave, and resolving it with an experiment is worth more than defending whichever number arrived first.
The blended metrics that sit above the three methods and prevent gaming
MER asks only whether the business, in aggregate, made more money than it spent acquiring it, without touching attribution logic.
MER doesn't travel alone. These are the numbers that predict whether a business survives, regardless of which channel gets the credit for this month's sales.
It tracks that operator priorities have shifted to match. Profitability metrics have displaced pure visibility metrics as the brands running these numbers have matured past the "more traffic is always good" phase.
The real function of these blended metrics is as a check against the three attribution methods. If MTA, MMM, and incrementality are all pointing the same direction, say, toward increasing spend on a channel, but MER is deteriorating anyway, something upstream of channel-level measurement is broken. The top-down number catches what the three bottom-up methods, built to analyze channels rather than the whole business, are structurally unable to see. Review the blended metrics before the channel-level findings each month, not after. Sequence matters here: the aggregate view should frame how a brand reads the disaggregated one. Blended Marketing Efficiency Ratio (MER) as the anchor metric (Total Revenue ÷ Total Marketing Spend, per ask-luca.com) sidesteps attribution arguments entirely, measures aggregate efficiency, and cannot be gamed by adjusting attribution windows. LTV:CAC ratio, target 3:1 to 5:1 layerfive.com. Contribution margin, healthy above 35% layerfive.com. CAC payback period, under 90 days layerfive.com. The 60-day cohort repeat rate matters in context: the average DTC brand retains just 28.2% of customers for a second purchase, per ringly.io. Per the State of DTC Marketing Report via envive.ai, DTC operators prioritize conversion rate (75%), customer acquisition cost (63%), customer lifetime value (54%), and average order value (50%) as KPIs, with these profitability-focused metrics having replaced visibility metrics as brands mature paz.ai.
Where agentic commerce breaks the triangulation model
Every method described so far assumes a click, a session, or a spend line to model against. Agentic commerce removes all three. When ChatGPT completes a purchase through Instant Checkout, or Perplexity's Comet browser finishes a transaction, or a shopper asks Amazon's Alexa or Google's AI Mode to buy something, the agent itself becomes the last touchpoint. There's no ad click for MTA to track, no ad spend for MMM to model against, and no way for an incrementality test to isolate what the agent actually saw or why it favored one brand's product over another's.
This isn't a fringe scenario anymore. Adobe Analytics measured a 4,700% year-over-year jump in generative-AI traffic to US retail sites between July 2024 and July 2025 eco.com paz.ai nudgenow.com. ChatGPT was processing 50 million shopping queries a day as of February 2026, and Salesforce found that 20% of all global orders during Cyber Week 2025 were influenced by AI agents or shopping assistants eco.com paz.ai nudgenow.com. The infrastructure is catching up fast: Google launched its Universal Commerce Protocol at NRF in January 2026, Microsoft's Copilot Checkout went live in the United States the same month, and Shopify reported orders from AI-powered searches grew 15x year over year through 2025, alongside its December 2025 announcement of Agentic Storefronts enabling product discovery and commerce directly inside ChatGPT, Perplexity, and Microsoft Copilot nshift.com. An IBM Institute for Business Value study put the consumer side at 45% already using AI for some part of the buying journey, and Adobe separately found 38% of consumers had used generative AI for online shopping in 2025 paz.ai. This is a live shift in how purchases happen, not a speculative one.
The measurement consequence is blunt: agentic-driven orders are visible in revenue, but they're invisible to all three attribution methods as currently built. They inflate whatever bucket a brand labels "direct" or "unknown," and they quietly depress the apparent ROAS of every paid channel that ran earlier in the customer's journey, even the ones that did the actual work of building awareness. A brand that doesn't account for this will end up cutting channels that were feeding the exact demand an agent later fulfilled.
Two moves matter here, and both are available now rather than waiting for the industry to standardize a fix admetrics.io. First, track AI-referred sessions and agent-completed transactions as their own distinct cohort, separate from channel attribution entirely, rather than letting that revenue contaminate the read on paid channels. Second, treat catalog quality as a lever that operates before any attribution question even arises: structured, enriched product data is what gets a brand surfaced and chosen by AI shopping agents in the first place. Attribution measures what already happened. Catalog quality shapes whether an agent picks the brand.
A practical decision protocol for reconciling conflicting attribution signals
Reconciling three methods is a sequence, not a matter of reading three dashboards side by side and picking a winner, and the order matters as much as the individual reads.
Start with the blended metrics, MER against its 2.5x to 4x target layerfive.com. That's the top-down check on business health, run before opening a single channel-level report. Then pull the channel-level reads from MTA and MMM together and look for agreement first: where all signals converge on a channel's strength or weakness, act on it, since that convergence is the strongest evidence the current measurement environment produces. Where MTA and MMM diverge, don't referee the disagreement with a third opinion pulled from a different dashboard. Running an incrementality test lets the geo holdout or conversion lift study settle the question a spreadsheet can't.
Where all three disagree at once, stop and check the data pipeline before touching the budget: UTM consistency, pixel health, matching date windows across platforms. And driving all of this now is the agentic cohort, tracked apart from channel attribution and checked against catalog quality rather than against a click that no longer exists. Attribution was never going to be perfect. Running all three methods with discipline, reading the gaps as signal, and checking the whole thing against numbers no platform can inflate leaves a brand with something better than perfect: a set of decisions it can actually defend.