Minimum Detectable Effect Sizing for Ecommerce Experiments
Most ecommerce tests fail because teams set their minimum detectable effect wrong from the start.

Choosing a minimum detectable effect for an ecommerce A/B test is a calculation, not a guess, and most testing programs get it wrong in the same direction: they set the MDE too tight, chasing sensitivity they can't afford, and end up starving good ideas of a verdict. Setting it too loose instead buries real wins under a false "no effect." Both failures trace back to the same root problem: nobody ran the math before the test launched.
MDE means the smallest true improvement a test is built to catch with acceptable reliability. It falls well below the lift a team expects, and well below the lift anyone is hoping for. It's the line below which a false negative becomes an acceptable risk to take. Think of it like a microscope's resolution: a low-magnification lens sees the big stuff fine and misses everything smaller than its threshold. A test built with a large MDE works the same way. It will catch a redesign that moves the needle by 20%, but it stays structurally blind to the 3% lift that could pay for itself quickly.
Most teams never calculate MDE at all. They pick a round number because a calculator asked for one, or they skip the step entirely and let the test run until someone gets impatient and calls it. Both habits collapse into the same missed distinction: MDE describes the true, unknown difference between control and variant that the test is designed to catch, not the observed difference once the data comes in. That observed gap is what statistical significance measures, a separate thing entirely. MDE is the smallest lift that will register as significant at least 80% of the time, assuming the test runs at 80% power. Confuse the two, and the team is designing an experiment around hope instead of arithmetic.
The ecommerce baseline problem: why your conversion rate makes MDE harder than it looks
Every MDE calculation starts from a baseline conversion rate, and most DTC operators are working from a number they don't actually trust. The baseline isn't a rounding detail, it's the foundation the entire sample size math sits on, and a shaky foundation produces a confident-looking number that means nothing.
The spread across real DTC stores is wider than most people assume. Across 19 DTC store properties tracked by Top Growth Marketing over the twelve months ending June 2026, the median conversion rate came in at 1.17%, with most stores clustered between 0.92% and 1.52%, and the full range stretching from 0.20% up to 7.12%. The mean sat at 1.61%, about 38% higher than the median, pulled up by outlier stores at the top of the range. Blend Commerce's dataset covering 745 active Shopify stores from January through June 2026 told a different story: mean of 2.61%, median of 1.74%. Same industry, different population, meaningfully different baseline.
That spread matters because the same absolute lift means something completely different depending on where a store starts. A store converting at 1.2% and a store converting at 4% aren't facing the same math for an identical absolute percentage-point gain. For the first store, that gain is a substantial relative lift. For the second, it's under 8%. Sample size requirements diverge sharply from there, and no calculator can paper over that gap.
There's a timing problem stacked on top of this, too. IRP Commerce platform data shows conversion rates fell roughly 8 to 10% year-over-year in late 2025 and early 2026. A baseline pulled six months ago may already be stale by the time a test launches. Pull a trailing twelve months of GA4 data directly from the account being tested, and segment it properly: sitewide conversion rate is almost never the right number to feed an MDE calculator. Use the conversion rate for the specific step the test actually touches, whether that's a product page, a cart drawer, or a checkout flow.
The inverse-square law: how a small change in MDE creates a massive change in test duration
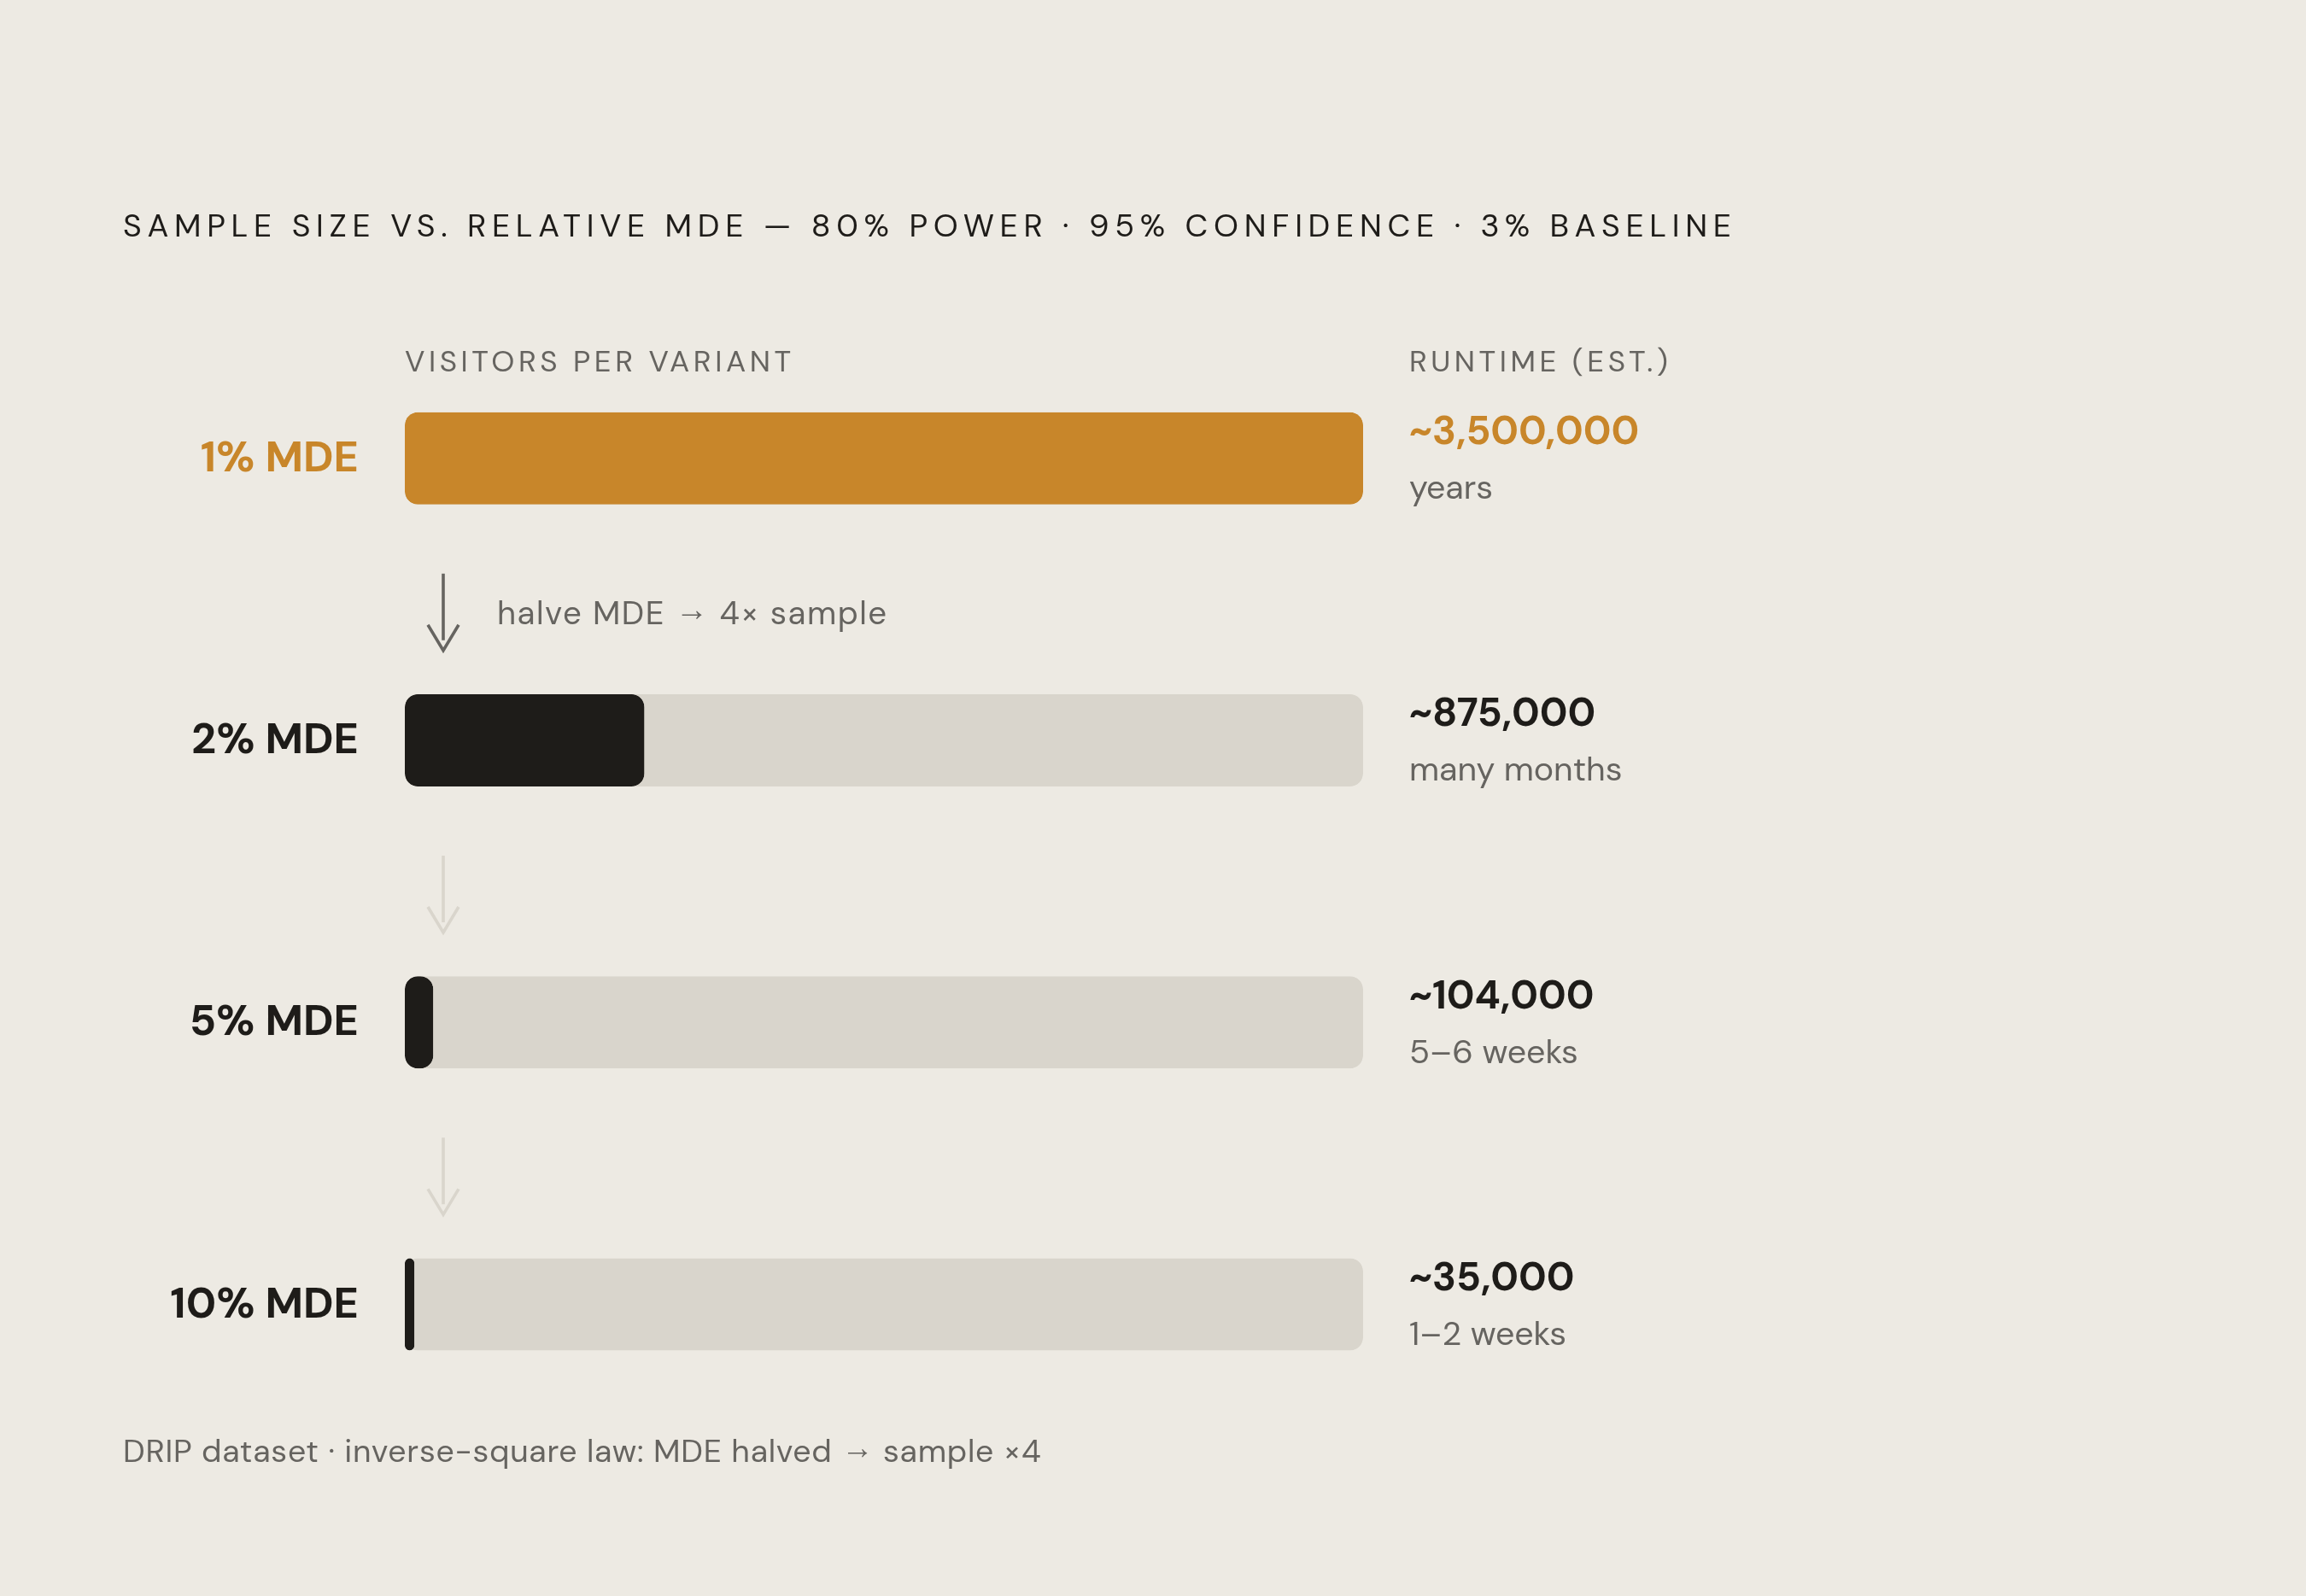
MDE and sample size don't move together in a straight line. The relationship follows an inverse-square law, and that single mechanical fact explains more about why ecommerce tests fail than anything else in the process. Halving the MDE does not merely double the required sample size. Halving the MDE means the required sample size does not merely double, since it quadruples.
DRIP data at 80% power, 95% confidence, and a 3% baseline conversion rate lays out the pattern. Targeting a 1% relative MDE calls for roughly 3.5 million visitors per variant at those power and significance settings, years of runtime for a typical DTC store. Dropping the target to 2% relative brings the requirement down to around 875,000 visitors per variant, still many months. At 5% relative, it's about 104,000 visitors per variant, somewhere around five to six weeks for a moderately trafficked store. At 10% relative, roughly 35,000 visitors per variant closes the test in one to two weeks.
A team that insists on a 1% MDE target will run a fraction of the experiments per year that a team targeting 5% can run, and that gap compounds every quarter. It doesn't cost a program once and stop costing it.
Optimizely's own documentation makes the same point with a concrete case: a 10% baseline conversion rate and a 5% MDE calls for about 62,000 visitors per variation, 124,000 total, to detect a 5% or greater change at 95% significance. The pattern holds at other baselines as well: as the baseline conversion rate falls or the MDE tightens, sample requirements rise steeply, often by multiples rather than increments.
The exact figures matter less than the shape of the curve. Low baseline conversion rates and low MDE targets combine to produce sample requirements that blow past what most DTC stores see in a month, sometimes in a year.
What ecommerce experiments win by, and why most MDE targets are set too high
Case studies love a 30% to 50% uplift. Those numbers get shared because they're remarkable, not because they're common, and building an MDE target around them is survivorship bias dressed up as ambition. Most teams that set their MDE at 10% are, without realizing it, designing a test that can only ever confirm the rare home run and will call every ordinary win a failure.
The DRIP experiment database, drawing on results across more than 90 ecommerce brands, gives a more honest picture. Among winning tests, the mean conversion rate uplift came in at 2.91%, and the mean revenue-per-visitor uplift at 4.15%. The medians run lower still: about 2% relative for conversion rate, roughly 3.5% relative for RPV. Median test duration across the dataset landed at 42 days.
Breaking down the distribution of winning effect sizes makes the case even more directly. Lifts between 0 and 1% relative accounted for 18% of winners. Lifts between 1 and 3% made up 37%, meaning 55% of all winning tests came in below a 3% relative lift. Add the 3-to-5% band, which covers 20% of winners, and 75% of everything that actually worked fell under a 5% relative effect. Only 16% of winners landed between 5 and 10%, and just 9% cracked 10% or higher.
Setting an MDE target at 5% or above causes a testing program to throw away roughly three-quarters of its real wins before they get the chance to ship. Those wins don't fail outright. They register as inconclusive, get filed away, and never make it past the "no significant result" line in a deck.
The right target for most DTC stores isn't 10% or 20%. Those numbers are floors that traffic constraints impose on underpowered programs, not targets anyone should aim for on purpose. A practical rule that lines up with the DRIP data: aim for around 5% MDE as a starting point, tighten to 1 to 2% for high-traffic sites that can support it, and loosen to 10% only when traffic genuinely won't allow anything tighter. In practice, the goal is the lowest MDE a store can reach inside a reasonable testing window.
Conversion rate vs. revenue per visitor: choosing the right metric before calculating MDE
The metric a test optimizes for changes the entire MDE calculation, and that decision has to happen before any sample size math starts.
Conversion rate is binary: a visitor either converts or doesn't, scored as 1 or 0. At the conversion rates common in ecommerce, typically somewhere between 1% and 10%, that binary structure keeps variance relatively low and the statistics tractable. Revenue per visitor behaves differently. It's continuous, shaped by both the probability of converting and the size of the order once someone does, and a single high-ticket purchase can swing the average enough to inflate variance well past anything conversion rate ever shows.
The practical gap between the two metrics is large. In practice, a test sized to detect a given relative MDE on conversion rate will typically be sensitive enough to catch only a substantially larger relative MDE on RPV. At a 10% relative MDE, 95% confidence, and 80% power, a conversion rate test starting from a low baseline needs tens of thousands of visitors per variation. A revenue-per-visitor test needs substantially more visitors per variation for that same relative effect size, given the higher variance introduced by order-value spread. Revenue metrics run hungrier for traffic than proportion-based metrics, often by a factor of two to five, and teams that don't plan for that gap end up shocked when an RPV test that "should" finish in a month is still running in July.
Conversion rate should carry the statistical weight here, with revenue per visitor riding alongside as a guardrail rather than the primary target. A variant that lifts conversion rate while tanking RPV is converting more low-value shoppers at the expense of order value, a net loss dressed up as a win. A variant that lifts RPV without moving conversion rate at all may be producing a real revenue gain that a conversion-rate-only test isn't sensitive enough to register. One common fix for RPV's outlier problem: cap transactions above a defined threshold before running the analysis. That trims variance substantially while keeping the underlying economic story intact.
A practical framework for calculating MDE from your own traffic and revenue numbers
Two approaches work here, traffic-first and revenue-first, and which one applies depends on whether the traffic ceiling or the business case is the binding constraint. Traffic-first should be the default. Reach for revenue-first only when the test carries unusual strategic weight, because working backward from business value takes longer and requires assumptions a traffic-first calculation doesn't need.
Pull monthly unique visitors to the specific page or funnel step being tested from GA4, using a trailing 90-day minimum. Decide the maximum test duration the roadmap can tolerate, typically four to six weeks, and multiply that by weekly traffic to get the total sample available. Split that evenly between control and variant to get the per-variation ceiling. Feeding the baseline conversion rate, the per-variation sample size, 80% power, and 95% confidence into an MDE calculator produces the floor MDE as the output: the smallest effect that test can actually detect inside that window. Sanity-check that floor against the DRIP win distribution. If the floor comes back at 10% or higher relative, and three-quarters of real wins land under 5%, that test doesn't belong on the roadmap in its current form.
Revenue-first works backward from business value instead. Translate a range of possible effect sizes, say 2%, 3%, and 5% relative lift, into their annual revenue impact at current traffic. Pair each figure with the test duration it would need at the store's actual traffic level. Then find the MDE where the expected annual value of catching that effect clears the opportunity cost of running the test at all.
A checkout page converting at 4%, with 60,000 eligible visitors a month, gives 30,000 visitors per variant as a worked example. At 80% power and 95% confidence, the floor MDE comes out to roughly 12% relative. In plain terms, that test can distinguish a 4.0% conversion rate from a 4.5% rate, but it cannot distinguish 4.0% from 4.2%. Anything under a 12% relative lift returns a null result that says nothing useful, because the test was never built to see the change, whatever effect it had.
The sweet spot sits where test duration runs one to four weeks, the detectable effect is large enough that shipping it would justify the engineering cost, and the power is high enough that a null result actually means something. Check the store's own experiment history, too. If nothing in the archive has ever produced a 10%-plus effect, setting the MDE at 10% guarantees the program keeps returning negative results, regardless of whether the ideas being tested have any merit.
What to do when your traffic is too low to detect the effects that matter
Some stores, particularly those in that 0.92% to 1.52% median conversion range with moderate traffic, genuinely cannot run a meaningful A/B test on a small effect in a reasonable amount of time. That's arithmetic, not a failure of effort or imagination, and no amount of wishing changes the sample size math.
The fix at low traffic is to let the traffic dictate the MDE. Enter a realistic test window, usually four weeks of visitors per variant, into an MDE calculator and accept whatever floor comes back, even if that floor is 10 to 20% relative for a smaller flow. If that floor exceeds any effect the proposed change could plausibly produce, A/B testing isn't the right tool for that element yet.
The work doesn't stop there, though. Session recordings, user interviews, and heuristic review can surface high-confidence problems without needing a statistically powered test to confirm them. Changes can also be made bolder: rather than testing one small tweak with a realistic shot at a 2% lift, bundle several hypotheses into one redesigned experience with a real chance of clearing the traffic-constrained floor. And tests should get pointed at the pages where traffic actually concentrates, checkout confirmation, top product pages, anywhere the sample accumulates fastest.
Convert.com's framing holds up well here: aim for the lowest MDE achievable inside a 2-to-8-week window. If the honest floor for a given page is 15%, and historical winners in the space average 2 to 3%, that's a signal to rethink the testing program's shape, not to force the test to run anyway. There's a hard limit on the other side of this trade-off, too: stretching a test past eight weeks to compensate for low traffic invites seasonality, external events, and novelty effects to contaminate the result, defeating the purpose of running a controlled test in the first place.
Common MDE mistakes that corrupt results before a test launches
Setting MDE equal to the expected effect is the most common mistake on this list, and it's a subtle one. MDE is supposed to be the smallest effect worth catching. Setting the two equal gives the test exactly enough power to detect the expected lift and no cushion at all, so any effect that comes in smaller than hoped, even a real one, disappears into noise. Set the MDE below the expected effect instead, so the test carries margin to catch a smaller-than-hoped but still genuine win.
The opposite instinct does its own damage: chasing the smallest MDE possible on the theory that more sensitivity is always better. Sensitivity isn't free. Halving the MDE quadruples the sample size needed to hit it, and a test built to detect a 1% effect on a moderate-traffic store simply never finishes, or finishes so late that whatever it was testing has already been overtaken by a different roadmap priority. MDE has to match what the traffic can actually deliver inside a window someone is willing to wait for, not what would be nice to detect in a world with infinite visitors. Pick the number the traffic supports, run the test, and move on to the next one.