Holdout Testing Cadence and Cannibalization Risk
Timing holdout tests wrong corrupts your baseline and makes results untrustworthy.

Holdout testing works only when it runs on a schedule that fits the question being asked. Running it too often turns the control group itself into a distortion, no longer a clean baseline but a population that's been partially exposed, partially suppressed, and quietly contaminated by the very channels the test was supposed to isolate. Running it too rarely, or timing it against the wrong seasonal window, makes the number that comes out the other end unusable. Cannibalization is the mechanism by which a badly designed or badly timed holdout produces a lift estimate that looks clean but isn't, and it underlies both failure modes.
That matters more now than it did a few years ago. Attribution models are correlative: they credit whichever ads sat near a conversion, not the ones that caused it. Per-channel ROAS overstates true return by roughly 2.3x heading into 2026. Safari and Firefox have blocked third-party cookies by default for years, and Google shut down most of Privacy Sandbox in October 2025, retiring the ten remaining APIs with no replacement while leaving third-party cookies untouched in Chrome. Roughly half the web has been effectively cookieless for a long stretch already. Significant variance between Meta Ads Manager and GA4 is now the norm. When the dashboards disagree with each other and with Shopify, the dashboards are the problem, not the business.
The four holdout designs and which questions each one can answer
Four designs cover almost every incrementality question a brand will need to answer, and each one is built for a different scale of spend and a different kind of question.
User-level holdout is the most accessible. A platform like Meta or Google draws a holdout group from the target audience, commonly 5 to 20% of it, and withholds campaign exposure from that slice. It works at any spend level and answers a narrow but useful question: is this one channel, on its own, driving incremental conversions? The limitation is structural. The platform controls suppression, and leakage happens whenever a held-out user shows up in a different campaign inside the same account, or gets reached by an entirely separate channel. It answers a single-channel question well. It cannot answer a cross-channel one.
Geo holdout, sometimes called matched markets, splits regions into test and control groups: test regions see the ads, control regions go dark. Granularity is a real tradeoff here. State-level splits carry the highest revenue and the strongest statistical power, but there are only so many states to combine. DMA-level splits open up more combinations and more flexibility, at the cost of lower revenue per cell. ZIP or cluster-level splits offer the finest granularity, but they come with the highest variance and the highest spillover risk, and they demand large budgets and careful clustering to avoid contaminating the control region with overflow from the test region. Geo holdouts are the right tool for cross-channel incrementality, for testing TV or out-of-home alongside digital, and for full media blackout tests. They need meaningful monthly spend to work, and matching two markets perfectly is harder than it sounds.
Time-based on/off testing is the one everyone runs first, because it requires no special setup: run the ads, pause the ads, compare conversion rates across the two windows. It's also the weakest of the four designs. Seasonality, ad fatigue, and organic momentum all bleed into the result, and there's no control group to net any of that out. Treat it as a quick sanity check on a single channel. Don't build a budget decision on it.
Matched market testing validated through media mix modeling is the most rigorous of the four, and the least accessible. Holdout regions are designed to match a synthetic control derived from an MMM, so the control group becomes a statistical counterfactual rather than a literal geography. This is built for large brands already running MMM on a quarterly cadence, and it requires historical data and modeling investment that make it a poor choice for a brand running its first test.
The selection rule that falls out of all four: user-level holdouts are where most DTC brands start, and geo holdouts are where brands spending at real scale across several channels graduate to.
What pre-test fit quality predicts about whether a test is worth running
Budget and duration get most of the attention when a brand plans a holdout test, but neither one predicts success as well as pre-test fit quality does. That's the single most important finding to come out of Stella's 225-test dataset. Tests where the pre-test MAPE came in below 0.15, paired with an R² between 0.85 and 0.94, reached 100% statistical significance. That's not a coincidence of good luck with a particular channel; it's a direct consequence of how well the test and control groups tracked each other before the test even started.
Across the full dataset, 88.4% of tests reached statistical significance at 90% confidence or better, which is a strong number, but it needs a caveat. The dataset reflects self-selected, measurement-sophisticated DTC advertisers, and Stella itself notes that brands using the platform likely perform 15 to 25% better than a typical DTC advertiser. So the number describes what's achievable under good conditions, not what happens by default.
The pre-test baseline period, typically four weeks, is where the job is to confirm that the test and control groups behave similarly before any exposure changes. Skipping that validation step means a divergence during the test could come from the media, or it could come from two groups that were never comparable to begin with, with no way to tell which.
How often to run holdout tests without letting the control group distort the baseline
Attribution isn't a setup task performed once and left alone; it's an ongoing discipline that needs to be revisited on a schedule tied to real triggers. Three of those triggers appear consistently: adding a new channel, absorbing a major platform change (an iOS privacy update, a pixel change, a GA4 migration), and standing in front of any large budget decision.
Practitioners tend to agree on where to start when resources for testing are limited: test the biggest and most suspicious line items first. Branded search is a widely recommended starting point, and the benchmark data below explains why. Some practitioners recommend reserving a defined share of total media budget toward incrementality testing specifically, as a way of validating whether ads are driving new revenue. That allocation isn't just a testing tip; it's a budget discipline that caps, in practice, how many tests a brand can run at once, since incrementality testing itself draws down spend that would otherwise go to media.
Duration matters as much as frequency. Four weeks is treated as the floor for seasonal businesses, longer windows of six to eight weeks are appropriate for display and programmatic campaigns, and anything with a long purchase cycle needs meaningfully more runway before the result means anything. Running tests more frequently than these durations allow doesn't produce more information: it produces control groups that never fully settle into a stable baseline before the next test disturbs them again.
Seasonal drift as a cadence trap, why timing a holdout wrong produces a number you cannot use
Seasonality is the textbook exogenous shock that corrupts a holdout result, and it does it in a way that's easy to miss because the test still produces a clean-looking number. A test that straddles a demand peak will show inflated lift in the test region the moment the control region's peak shifts even slightly out of sync, because the two regions are no longer being compared under matched conditions.
The fix is mechanical: the pre-test baseline period, four to eight weeks, needs to span the same seasonal window as the test period itself wherever that's possible. Comparing an October baseline against a test period that covers Black Friday produces a counterfactual that was never valid to begin with, no matter how clean the math looks afterward.
Stella's benchmark dataset runs from August 2024 through December 2025, a window that covers two separate holiday seasons. The channel-level variance inside that dataset, an interquartile range running from 1.36x to 3.24x around a 2.31x median iROAS, partly reflects genuine differences in seasonal execution across brands, not just differences in channel quality. Matched market testing is especially exposed to this problem when the two regions being compared have different peak timing: a DMA centered on a ski destination and one centered on a beach town can carry near-identical annual volume while running on opposite seasonal curves entirely, which will wreck a geo holdout that assumes the two regions move together.
What cannibalization measures and why most brands misread it as channel success
Cannibalization gets used loosely, but it actually refers to two distinct mechanisms, and conflating them is where most of the misreading happens.
Promotional cannibalization is the simpler of the two: a discount reaches buyers who would have paid full price anyway, so the brand surrenders margin without generating any new revenue. Cross-channel cannibalization in holdout design is the subtler and more consequential version: one channel's holdout suppresses or inflates another channel's lift estimate, turning what looks like a clean incrementality number into a measurement artifact.
Both mechanisms trace back to the same root cause. The counterfactual, the answer to "what would have happened without this," is corrupted in both cases, just through different plumbing. The measurable signal of cannibalization inside a holdout result is negative incrementality: the control group outperforming the test group, which shouldn't happen if the media were genuinely driving incremental demand.
Practitioner analyses of promotional cannibalization put broad public coupons at 20 to 60% cannibalization: a substantial share of redemptions come from buyers who needed no incentive. Targeted offers, the kind aimed at abandoned carts or new-customer-only segments, run much lower, in the 10 to 25% range, because the targeting itself filters out much of the audience that would have converted anyway.
How a flawed holdout design turns cannibalization from a finding into a hidden distortion
The design flaw that causes most of this damage is simple to state and easy to fall into: running a holdout on one channel in isolation while every other channel keeps reaching the control group without interruption.
Picture a Meta geo holdout that blacks out paid social in the control region. Email keeps sending, branded search keeps running, retargeting keeps firing, and all three keep reaching both the test and control regions equally. The control group still converts through those untouched channels, which compresses the apparent lift showing up in the test region. If any of those other channels are cannibalizing each other, that noise gets absorbed silently into the Meta holdout's lift estimate, and nothing about the output flags that it happened.
User-level holdouts carry this risk in an even sharper form. The platform withholds exposure to the specific campaign under test, but the same user can still be reached by a different campaign in the same ad account, or by a completely separate channel. A user-level holdout is not a true media blackout; it's a campaign-level suppression dressed up as one.
Running simultaneous multi-channel holdout tests, testing several channels for incrementality at the same time, can actually reveal these cross-channel interaction effects rather than hide them. But it only works if the holdout groups are built so they don't overlap, since overlapping holdouts just reintroduce the same contamination the design was meant to eliminate.
Channel benchmarks that reveal where cannibalization risk is highest by default
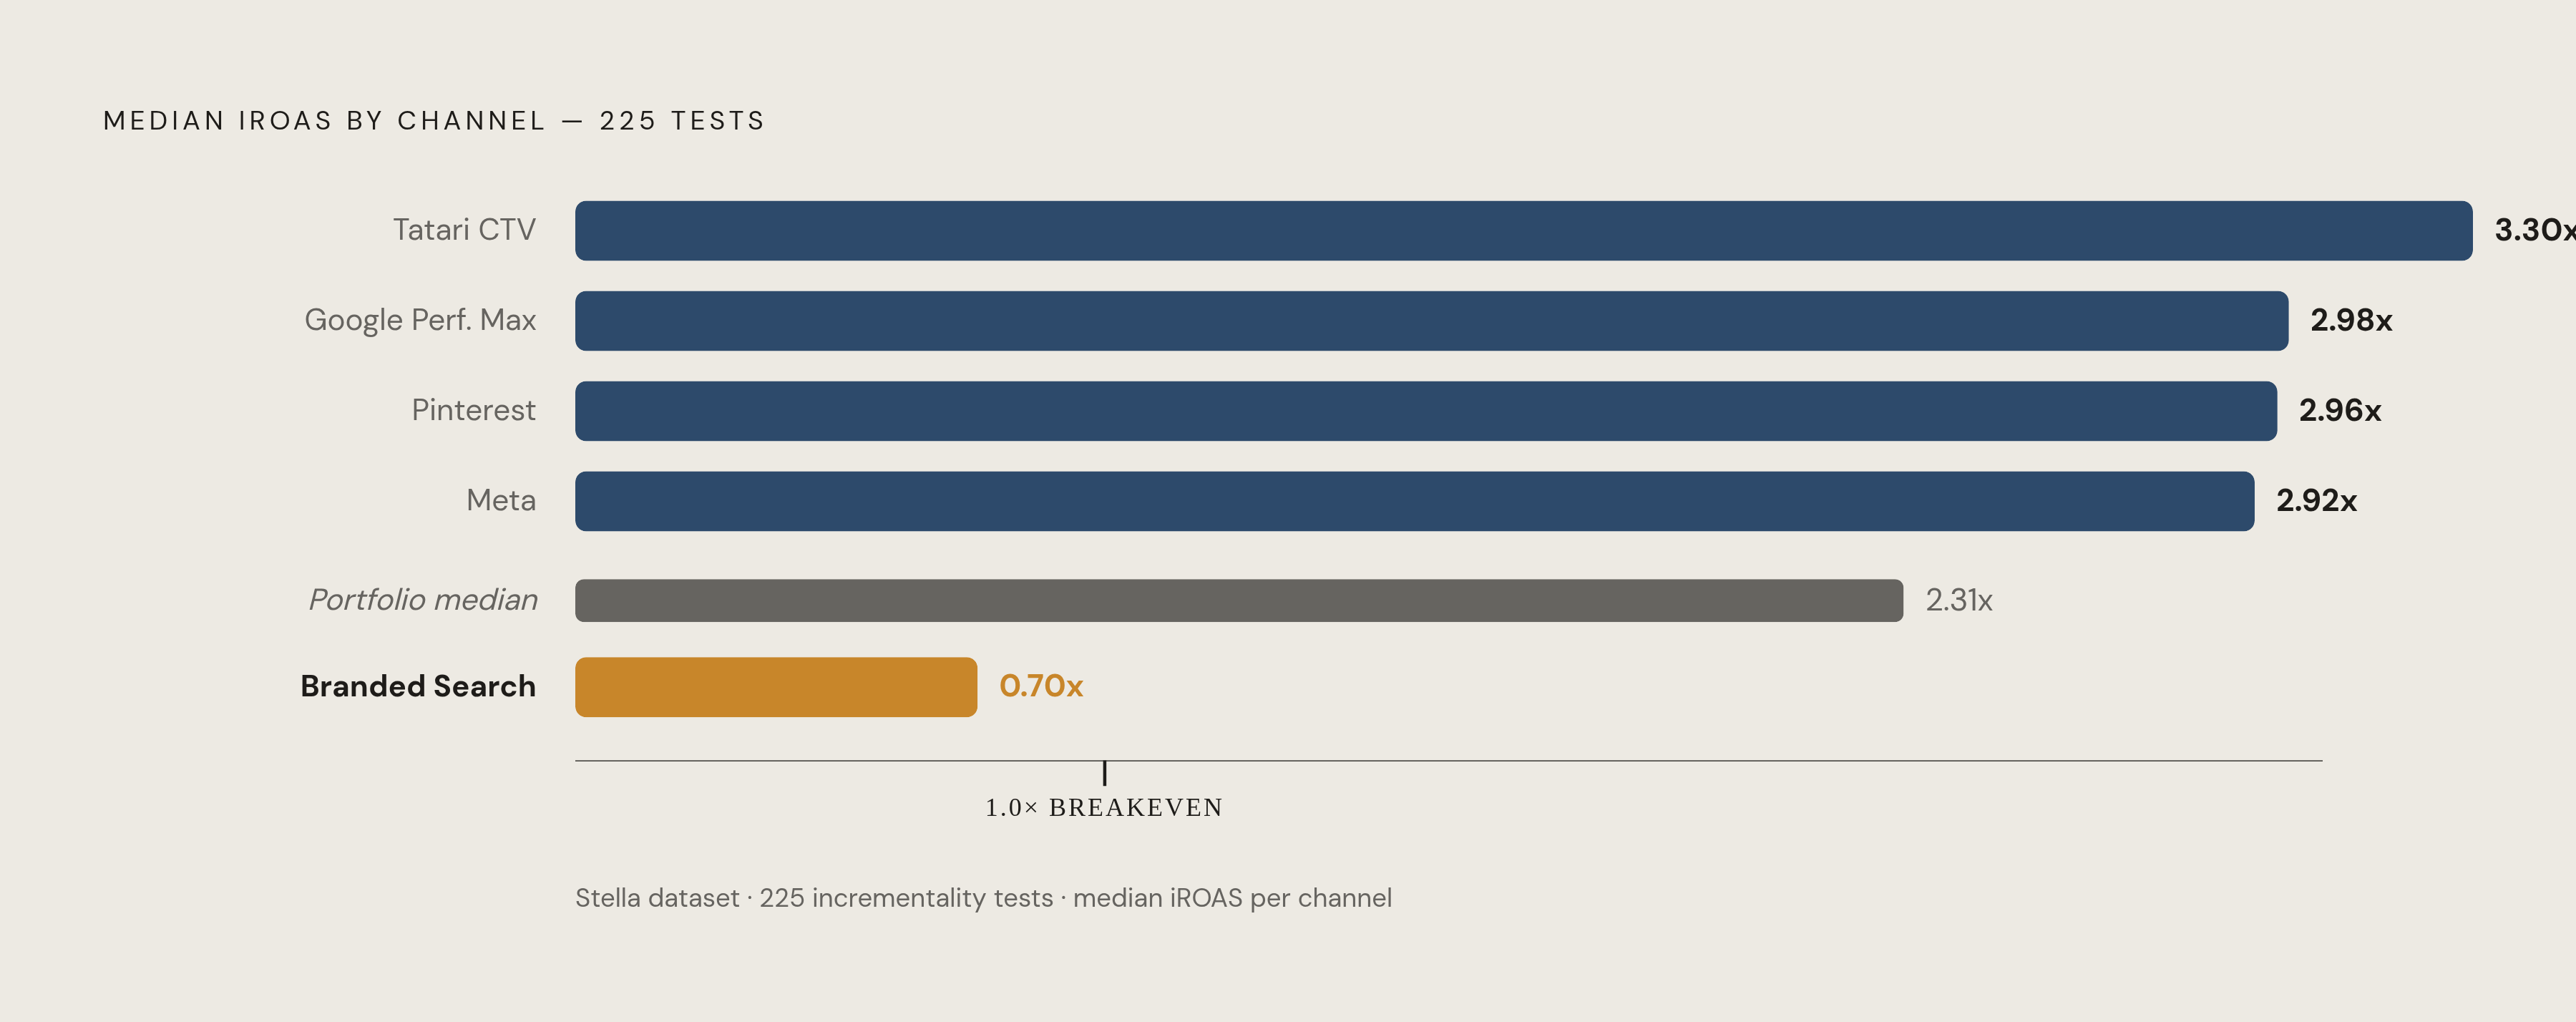
Stella's 225-test dataset offers the most complete public set of channel benchmarks available for 2025 DTC geo-based incrementality testing, and the spread across channels is wide enough to change how a brand should prioritize its testing budget.
Tatari CTV posts the highest median iROAS in the dataset at 3.30x. Google Performance Max follows at 2.98x, Pinterest at 2.96x, and Meta at 2.92x. Branded search is at the opposite end entirely: a median iROAS of 0.70x, the lowest of any channel tested and well below the 1.0x breakeven line. The full-portfolio median across every channel tested is 2.31x, with an interquartile range running from 1.36x to 3.24x.
That 0.70x branded search figure is the starkest quantified cannibalization signal anywhere in the dataset. At the median, brands spending on branded keywords are destroying value, paying for clicks they would have earned organically without spending a cent. It's the single clearest case in the data of a channel taking credit for demand it didn't create.
None of these numbers should be read as fixed ceilings or floors, though. The coefficient of variation across all channels is 0.67. Execution quality and channel fit swing results almost as much as channel choice itself does. A brand running Performance Max poorly can easily underperform a brand running branded search well, even with the medians pointing in opposite directions.
Retargeting doesn't get its own line in the Stella benchmark set, but practitioner consensus across multiple sources places it as the channel most likely to show inflated ROAS under standard attribution and sub-breakeven incrementality once tested through a proper holdout. It's the clearest recurring case of a channel getting credit for reaching people who were already on their way to buying.