GEO-Based Holdout Tests for Shopify Brands
Shopify brands are discovering their ad ROI figures are wildly inflated.

Every platform dashboard tells a Shopify brand how much revenue each channel drove. What none of them can tell you is whether that revenue would have shown up anyway. Return on ad spend, as reported by Meta or Google, measures credit assignment: it answers "which channel gets to claim this sale," not "did this ad cause this sale." That distinction now separates a brand that grows from one that quietly bleeds margin while its dashboards look fine.
Per-channel ROAS overstates true return by roughly 2.3x on average. That gap didn't appear overnight. It's the compounding result of two separate breakdowns in the tracking infrastructure that platform attribution depends on. Apple's App Tracking Transparency rollout, alongside iOS 14.5, pushed somewhere between 75% and 85% of iOS users to opt out of cross-app tracking, which meant Meta lost visibility into most iPhone purchase journeys. Then, in March 2026, Meta redefined what counts as a click, removing likes, shares, and saves from the calculation. Reported ROAS dropped 15 to 30% overnight. Tracked across 3,014 e-commerce advertisers, average ROAS fell 7%, and prospecting ROAS, the campaigns meant to find new customers, fell 13%.
The cookie side of the ledger isn't any healthier. Google reversed its plan to deprecate third-party cookies in Chrome and shut down most of Privacy Sandbox in October 2025, without shipping a full replacement. Safari and Firefox have blocked third-party cookies by default for years, so roughly half the web has effectively been cookieless well before Meta's redefinition made things worse. Attribution was degraded long before this became a headline problem; the recent changes just made the degradation impossible to ignore.
The economics make this urgent rather than academic. Median DTC contribution margin fell from 35% in 2021 to 22% in 2025, as paid acquisition costs climbed. Brands now lose an average of $29 on every new customer acquired, and platform-reported ROAS figures have come under growing pressure across verticals. Under those margins, a brand that allocates budget based on a platform's self-reported ROAS is making decisions based on how well each channel argues for itself, not on how much incremental behavior it actually causes. That's the problem incrementality testing exists to fix, and for most Shopify operators, the fix doesn't require a data science team. It requires a well-designed geo holdout.
What incrementality testing measures, and why geo is the right design for most brands
Incrementality is a specific, testable quantity: the percentage of conversions that would not have happened without a given marketing intervention. It is the output of a controlled experiment, structured so that a business can compare what actually happened against what would have happened anyway. It's the output of a controlled experiment, structured so that a business can compare what actually happened against what would have happened anyway.
There are four ways to run that experiment, and they trade off differently. Platform-native conversion lift studies, offered by Meta and Google, are free and simple to set up, but each platform is grading its own homework, and neither captures what happens when a customer is influenced across multiple channels before buying. Audience holdout tests require careful audience segmentation, and their control groups degrade over time as "holdout" users get exposed to the same messaging through other means, a known limitation of the design. Full channel holdouts, where a brand suppresses an entire channel completely, are operationally disruptive and generally require substantial scale to produce a clean read, and even then, isolating the effect cleanly is a structural challenge.
Geo holdouts sit in the middle, and for most Shopify brands, they're the practical answer. A geo holdout suppresses advertising in a defined set of markets while running normally everywhere else, then compares outcomes between the two. It requires no platform configuration beyond excluding specific zip codes, DMAs, or regions from targeting. Because the suppression happens at the geographic level rather than the audience or channel level, it captures cross-channel effects automatically: if a Meta ad influences someone who then converts through organic search, a geo holdout still counts it, because the whole market is being measured, not a single platform's reported conversions. And because every Shopify order carries a shipping address, the measurement layer is data no platform policy change can touch. The minimum spend threshold is around $20,000 a month, which puts the method within reach of a wide swath of DTC brands, not just the ones with seven-figure media budgets.
The output of a geo holdout is incremental ROAS, or iROAS: revenue in exposed markets attributable to incremental lift, divided by total ad spend in those markets. That single number tells a brand whether its spend is generating business it wouldn't otherwise have, or whether it's mostly buying credit for behavior that was going to happen regardless.
The evidence that attribution methods overstate impact isn't anecdotal. Gordon, Zettelmeyer, Bhargava, and Chapsky published research built on 500 million user-experiment observations and 1.6 billion ad impressions across 15 Facebook advertising experiments. Observational and attribution-based methods were off by a factor of three in half the studies examined, and checkout conversion outcomes, the exact use case that matters to a Shopify brand, were among those where the measurement gap was most consequential.
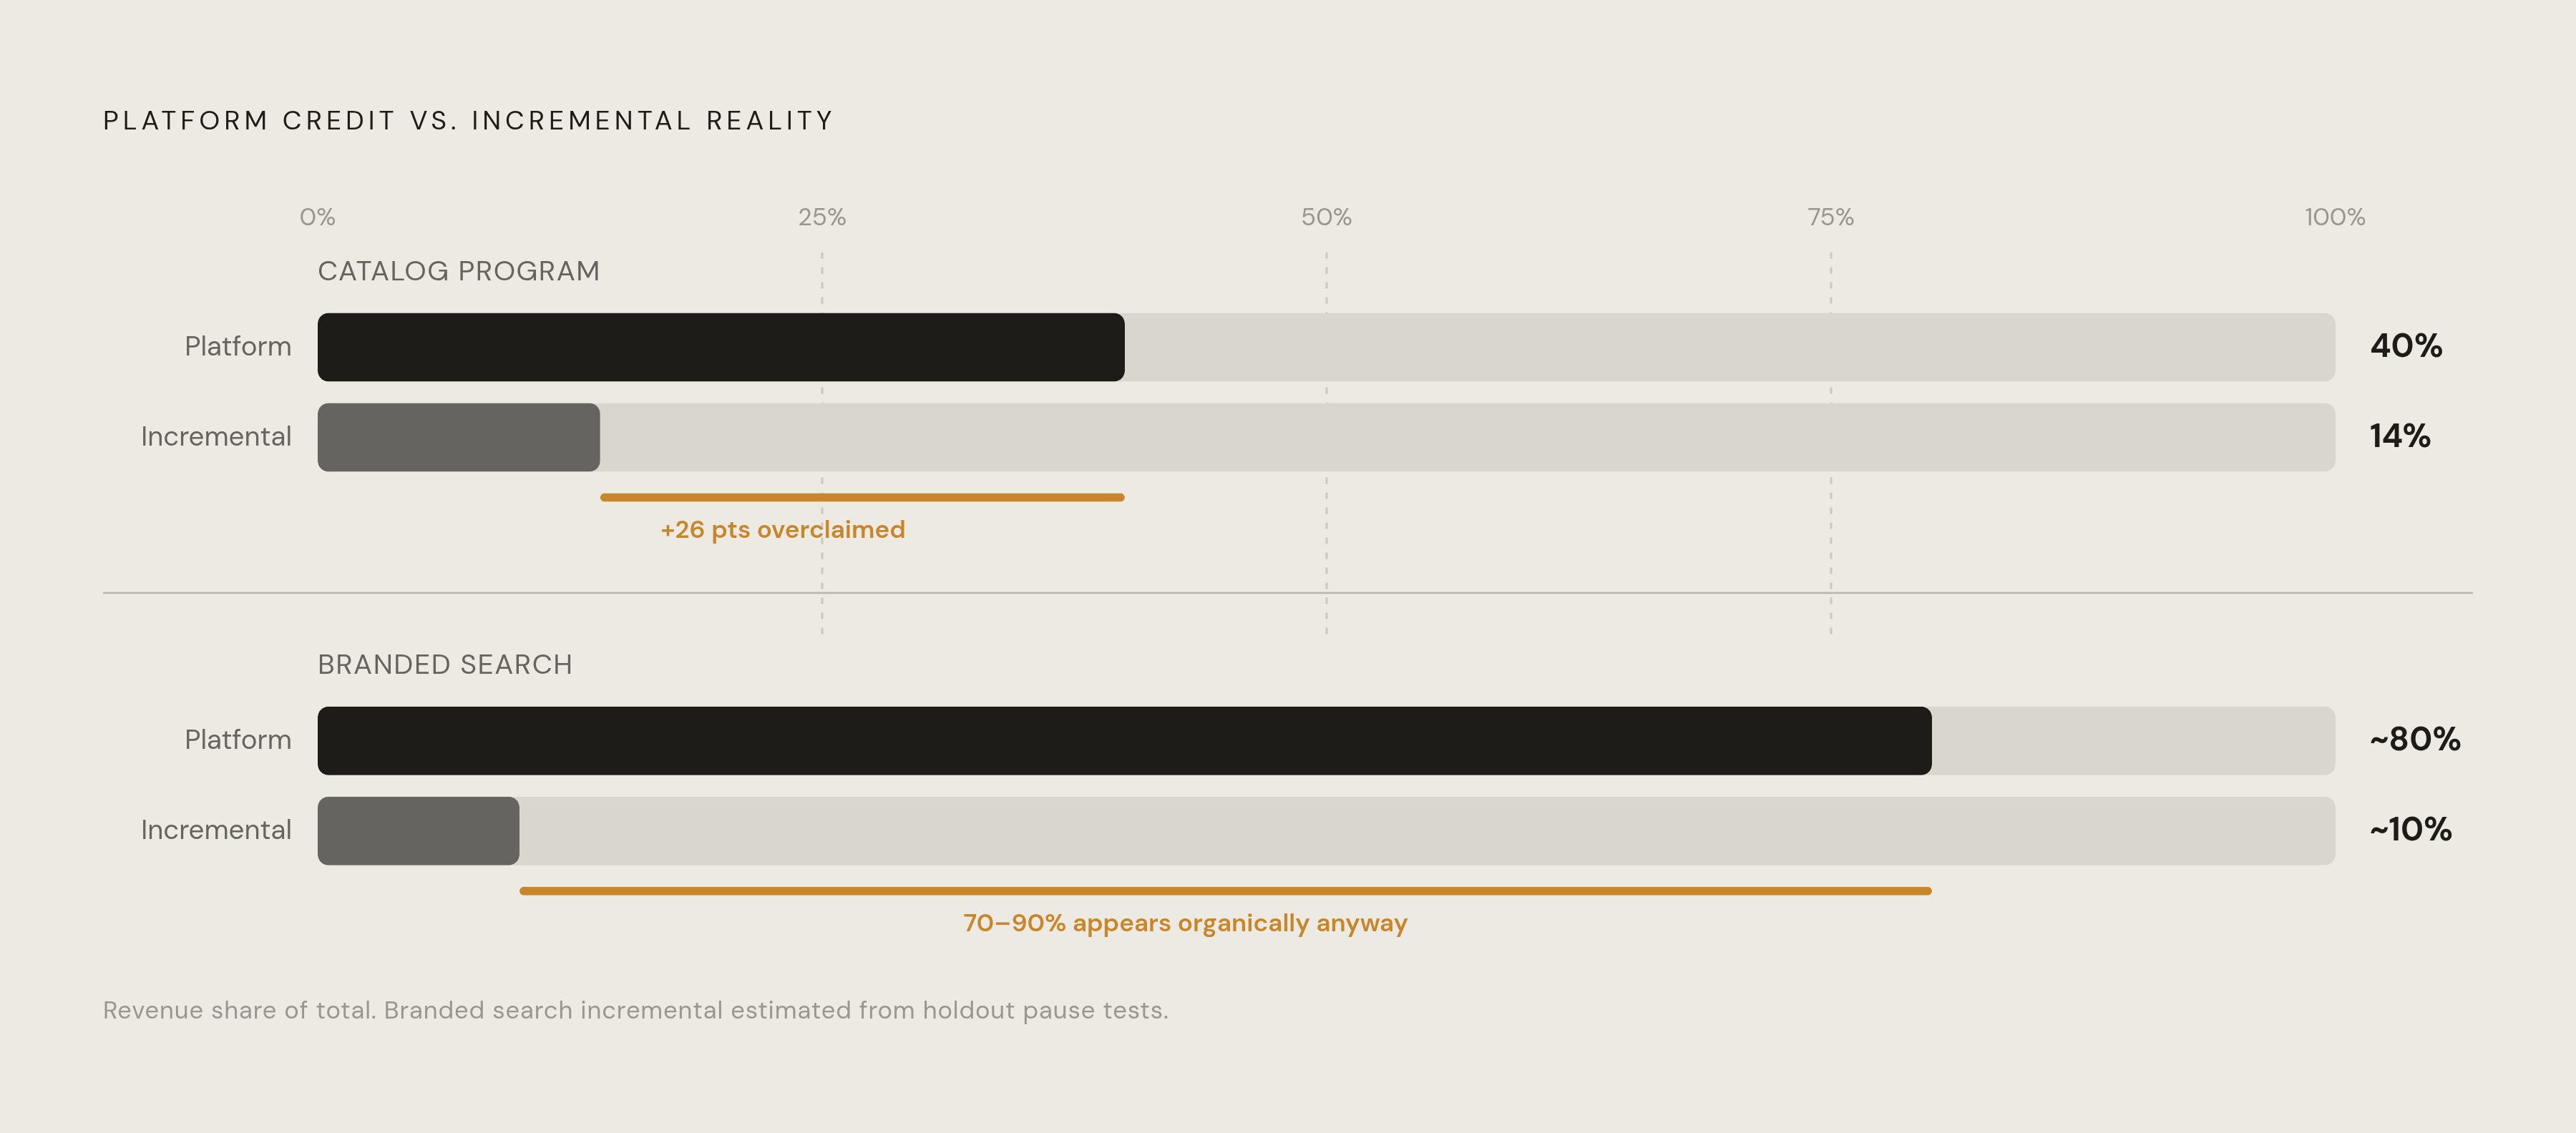
Branded search is where pausing campaigns most starkly reveals overstated attribution for operators running their first test. Brands that pause branded search campaigns in holdout markets routinely discover that 70 to 90% of that "revenue" shows up anyway, through organic search listings that were sitting right below the paid ad the whole time. One widely cited test, run by a retail chain. grocery chain across 12 test markets, found the sales lift from non-branded paid search at exactly 0%. The ad wasn't generating demand. It was intercepting demand that already existed.
The five design decisions that determine whether a geo holdout produces a trustworthy result
A geo holdout is simple in concept and easy to get wrong in practice. Five decisions shape whether the result means anything.
Start with what to test first, and test one channel at a time. Suppressing Meta and branded search simultaneously introduces noise that makes it impossible to attribute the resulting lift, or lack of it, to either channel specifically. Most brands start with Meta, since it typically carries the largest budget and the widest gap between reported and real return, or with branded search, since it's the channel most likely to be claiming credit for demand it didn't create. Frame the test as a specific, falsifiable question: if all Meta prospecting paused in these markets for four weeks, how much revenue would actually be lost? That specificity makes the test designable.
Market selection and sizing come next, and this is where most manual tests go wrong. Holdout markets should collectively represent around 25% of baseline Shopify revenue, small enough that pausing ads there doesn't meaningfully damage overall performance during the test, large enough to produce a statistically reliable read. The holdout markets and the control markets need to be matched on baseline purchase rate before the test starts; a test is only as good as how comparable those two groups were on day one. Google's own geo experiment design draws test region boundaries from aggregated postal codes, running the boundary lines through the least populous areas possible and avoiding well-known commute corridors, specifically to minimize contamination from a shopper who lives in a control market but works, and shops, in a test market. In one region, two neighboring states together typically represent 18 to 22% of national e-commerce revenue, which makes them a practical holdout unit at the state level for brands operating there.
Duration affects whether week-to-week variance in ordinary demand gets mistaken for a treatment effect. Four to eight weeks is the credible range, and the test needs to span at least one full purchase cycle, or week-to-week variance in ordinary demand will get mistaken for a treatment effect. High-volume categories can sometimes get a directional read in two to three weeks, but that's a signal to watch before acting.
Revenue thresholds set the floor for whether a test is worth running. Brands need roughly £500,000 or more in annual revenue to have the statistical power for a clean read. Even above that floor, if the holdout markets generated less than about £100,000 in revenue during the test window, the result is too noisy to trust, and the answer is to extend the window and run it again, not to act on an underpowered number.
Shopify order data, pulled by shipping address, is the source of truth. That data carries none of the cookie or attribution-window problems that plague dashboard-reported ROAS. Getting a first read doesn't require new tooling. A spreadsheet built from a Shopify export, broken out by region, is enough to run a manual holdout and get a directional answer.
Running the test: reading the result over four to eight weeks
Once the test starts, the discipline is in what you don't touch. Ads get suppressed in the holdout geographies and run normally everywhere else, and control markets need to stay untouched: no creative swaps, no bid strategy changes, no budget shifts, because any of those introduces a confound that makes the comparison meaningless. Running a second experiment that touches the same audiences or geographies at the same time has the same effect. Outside events, a promotion, a press mention, a seasonal spike, might hit one geography harder than the other, but the right move is to document those as potential confounds, not to abandon the test partway through.
The math itself is straightforward. Incremental lift is the revenue actually generated in exposed markets, minus the revenue that would have been expected in those same markets if no ads had run at all, a baseline estimated from how the holdout markets performed. Divide that lift by total ad spend in the exposed markets, and the result is iROAS. The gap between that number and the platform's reported ROAS for the same channel and period is the overclaim: most channels, once compared this way, show 30 to 90% over-attribution.
What that gap means in practice is best illustrated by a real case from the field. A specialty retailer's catalog program had been credited by the platform with driving 40% of total revenue. When measured through incremental lift, the actual contribution came in at 14%. The other 26 points were credit claimed for sales that were going to happen with or without the catalog. Brand search and broad retargeting tend to be the worst offenders, the channels where the gap between attributed ROAS and measured iROAS is consistently widest.
Statistical significance isn't optional. If the holdout generated under roughly £100,000 in revenue during the test window, the result is too noisy to act on, full stop. The correct response is to extend the window and retest, not to cut spend on the strength of an underpowered read.
A more advanced variant is the synthetic control method. Rather than comparing one holdout region against one control region, an algorithm builds a synthetic version of the treated market by blending many similar regions together, which reduces noise and cuts down on false positives. It's seen growing adoption among e-commerce operators in recent years, though it isn't yet the default approach for most Shopify brands running a first test.
Budget decisions after the test
The most common outcome, by a wide margin, is that iROAS comes in materially below the platform-reported figure. When that happens, the recommended move is to trim spend in that channel by 20 to 30% and redirect attention toward channels where the incremental return is better understood. The original channel is worth retesting in about 90 days at the lower spend level, since over-attribution often shrinks as spend drops, and the channel may turn out to be more efficient at a smaller budget than the initial test suggested.
According to Elevate Digital Solutions, most brands recoup the opportunity cost of running the test within a single quarter, through the better budget allocation the result makes possible. The test pays for itself even before accounting for the ongoing value of knowing which channels drive results.
None of this produces a permanent verdict, though. Incrementality shifts as creative fatigues, as seasonality changes, and as competitors adjust their own spend, so a single test is a calibration point, not a fixed answer stamped into the budget forever. The practice earns the most value when it's run periodically, quarterly for brands with active testing programs, rather than treated as a one-time project to check off.
The shift this supports is visible in how brands are setting priorities more broadly. Across the DTC space, KPI focus has visibly shifted away from visibility metrics and toward profitability measures like conversion rate, CAC, LTV, and AOV. Incrementality testing serves that shift directly, because it turns a budget decision from something argued on correlation into something defensible on causation.
The stakes of getting this right have only grown. Attribution reliability degraded substantially after iOS 14.5, and brands that invested in first-party data infrastructure have meaningfully improved the reliability of their measurement compared to competitors still leaning on platform pixels. A geo holdout is the diagnostic that shows a brand which side of that gap it's actually on.
Tools that run geo holdouts, and what each is built for
Enterprise pricing in this category is almost always custom-quoted, so any specific figure floating around online should be treated as directional at best. The comparison that matters is fit and design, not sticker price.
A manual geo holdout, built from a spreadsheet and a Shopify export, costs nothing beyond internal time. It's the right starting point for smaller brands trying to figure out whether incrementality testing is worth investing in before buying a platform, and it's genuinely sufficient for a first read. The limitation is that there's no automated statistical significance testing built in, so it's easy to walk away with a false read if the market matching and revenue thresholds aren't handled carefully.
Haus is a geo-experimentation platform built from the ground up for holdout testing, rather than a general attribution suite with testing added on as a feature. Its methodology reflects that focus, though the feature set is narrower than a full attribution suite, and it isn't meant to replace day-to-day attribution reporting. Haus's own 2025 industry survey found that only 39% of marketers named multi-touch attribution as their most trusted measurement method, which helps explain why dedicated experimentation platforms like it are gaining traction.
Northbeam offers geo testing through GeoLift, built into its broader attribution platform. Brands already running Northbeam can layer incrementality testing on without switching tools, which gives a unified view of attribution and incrementality in one place. The tradeoff is that GeoLift isn't sold as a standalone lightweight product; adopting it means adopting the full Northbeam platform.
Measured positions incrementality testing as a continuous operating practice rather than a one-off project, running ongoing geo experiments that feed budget decisions on a rolling basis. In October 2025, the company upgraded its Incrementality Model with on-demand model refresh, allowing the model to rerun instantly when inputs change, along with user-selectable inputs for real-time scenario planning, closing a gap that used to make marketing mix model outputs feel stale by the time a budget meeting happened. It's the strongest fit for mid-market and enterprise brands with dedicated growth teams testing every quarter, and probably overkill for a brand running a single one-off test.
Recast pairs Marketing Mix Modeling with incrementality validation, an approach that appeals to brands wary of how far pixel-based tracking has degraded since iOS 14. In September 2025, Recast launched GeoLift as a standalone geo lift testing product, which can supply calibration data to help validate the MMM, though results don't automatically feed back into the model. MMM needs a meaningful history of spend data across channels to produce reliable output, so newer or smaller accounts tend to get less trustworthy results.
Prescient AI adds a predictive layer on top of incrementality data, aiming to go a step further and recommend budget allocation directly rather than simply reporting a lift number. That convenience comes with a tradeoff: the predictive layer introduces a black-box element sitting on top of the underlying holdout data, which makes the recommendation harder to audit than the raw test result.
Rockerbox is now part of DoubleVerify, which completed its acquisition of the company in March 2025 for $82.6 million net of cash acquired, after announcing the deal at $85 million. The acquisition folds outcome measurement into DoubleVerify's broader ad verification suite, which is relevant context for any brand evaluating Rockerbox's product roadmap under new ownership.
Slingwave was unveiled at CES in January 2026, combining Bayesian marketing mix modeling, agile attribution, and experimentation under an intelligence layer that runs customized models across millions of scenarios to produce a spending optimization plan. The platform is described as improving continuously with each campaign it runs.
Causality Engine runs on a pay-per-use pricing model, with a one-time analysis priced at €99, offering a lower-commitment entry point for brands that want a single incrementality read without adopting an ongoing platform subscription.