Gross Margin per Order as the Correct DTC Profitability Unit
Per-order profit dollars reveal which DTC brands actually survive customer acquisition costs.

A direct-to-consumer brand can grow revenue every quarter, hold its gross margin percentage steady, and still lose money on the next order it fulfills. Revenue, ROAS, and gross margin percentage are the three numbers nearly every brand runs on, and the quiet failure of a decade of DTC reporting traces back to them. All three share a flaw. They get recorded above the gross line, and none of them says what the business actually keeps on any single transaction.
Revenue counts every dollar that lands in the account, with no regard for what it cost to produce the goods or how thin the margin ran on that order. Gross margin percentage looks more disciplined because it is a ratio, but a ratio only describes shape, not size: two orders can carry the identical percentage and differ by an order of magnitude in the dollars actually kept. Revenue, ROAS, and gross margin percentage all get optimized at the aggregate or campaign level, and the decisions that determine a DTC brand's survival, pricing, channel mix, fulfillment thresholds, discount depth, all get made at the order level. A metric built for the aggregate has nothing useful to say about the order.
What the public DTC P&L shows in the filings
The gap between percentage-rate thinking and dollar reality is not a theoretical concern. This gap is visible in audited financials. The State of DTC Profitability 2026 tracked a 10-brand public panel from FY2019 through FY2025, and it found that median gross margin rose slightly over that period. Gross margin percentage held. Operating margin collapsed. The product economics were not the problem.
Gross margin held near 47%, but the median public DTC brand still had a negative operating margin in FY2025. These brands were not losing money selling their products. They were losing it acquiring customers and carrying overhead. The spread across the category widens the point further. The benchmark runs from e.l.f. Beauty at the strong end of the public DTC set down to Beyond Meat near zero, a gap so wide that the median percentage figure barely means anything without anchoring it to dollars per order. A percentage rate tells you where a brand sits in its category. It does not tell you whether the gross dollars generated on a given order are enough to absorb the cost of acquiring and fulfilling that order. That is a different question, and it requires a different unit of measurement.
What gross margin dollars per order measures
Gross margin dollars per order, GM$O, is what a brand keeps after cost of goods sold on one transaction. It is what a single order contributes in dollars before any operating line gets touched, not a ratio or a campaign-level aggregate.
Getting that number right depends on what belongs in COGS and what does not. Product cost, inbound freight, customs duties, warehousing labor tied to inbound receiving, and inventory shrinkage all belong there. The calculation itself is straightforward once those components are scoped correctly: take net revenue for a single order, after discounts and returns, and subtract the COGS components listed above. What remains is GM$O. A brand can divide that figure by revenue to produce a percentage for comparison purposes, but the dollar figure, not the ratio, is the unit that actually drives operating decisions.
The distinction that trips up most DTC finance teams is what does not belong in COGS. Fulfillment costs, outbound shipping, merchant processing fees, pick-pack-ship labor, reverse logistics, are variable selling costs that sit below gross profit, not line items inside COGS. The Ecom CFO benchmark methodology is explicit on this point. Loading fulfillment costs into COGS understates gross margin and then double-counts those same costs when contribution margin gets calculated downstream, producing a GM$O figure that is wrong twice over.
Tracking a business at this level of granularity is not an exotic request. Grove Collaborative already reports DTC Net Revenue Per Order as a standing operating metric in its filings. GM$O applies that same per-order discipline to the margin a brand keeps.
How GM$O changes the ceiling on customer acquisition spend
Customer acquisition cost payback can only be calculated correctly when it is anchored to GM$O. Anchoring it to revenue instead systematically overstates how much a brand can afford to spend acquiring a customer, because a brand recovers its acquisition cost through the gross profit a customer generates, not through the revenue that customer's orders produce. If a brand's GM$O runs substantially below its CAC per order, it needs multiple orders before that acquisition cost is recovered, so the payback horizon stretches well past what a revenue-only view would suggest.
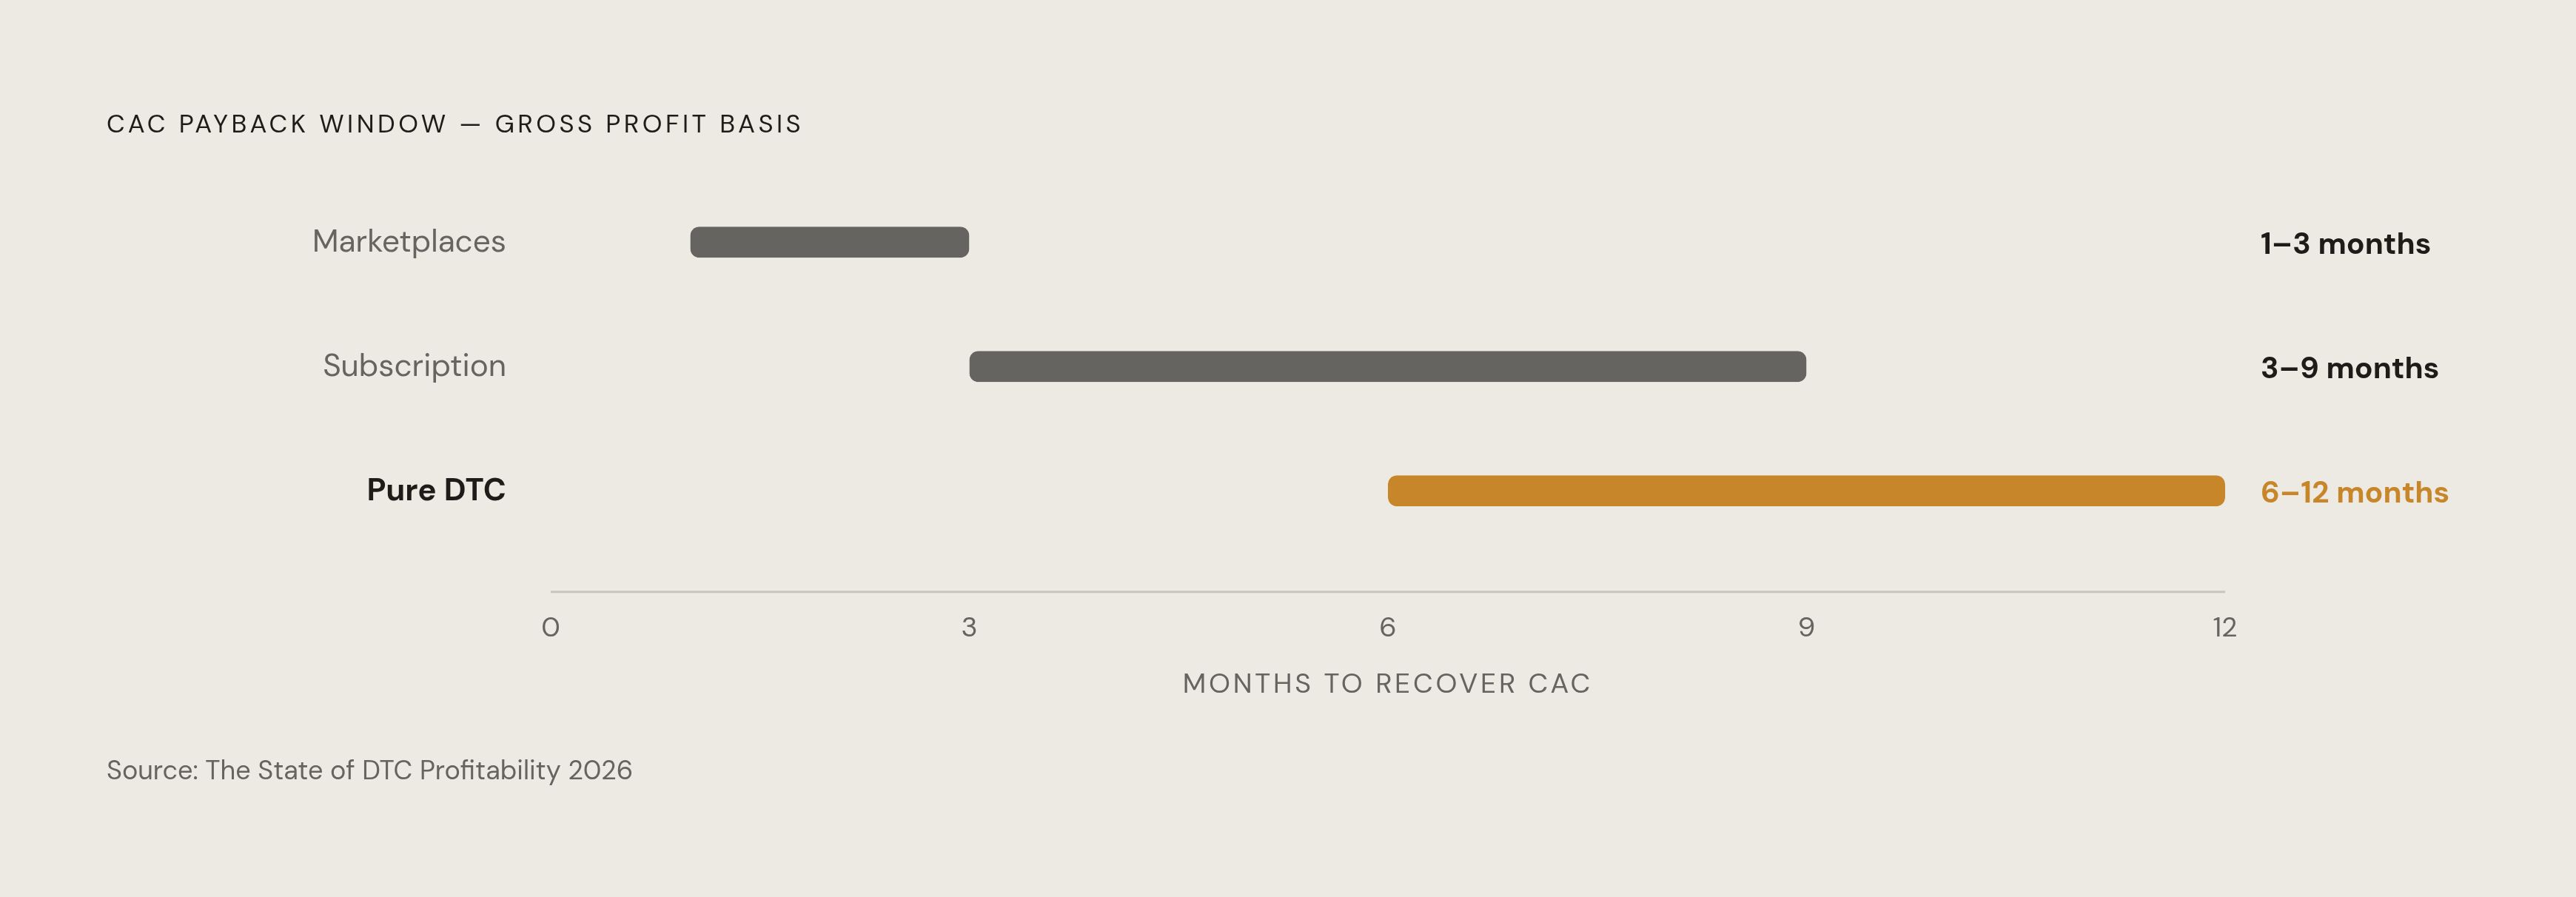
The State of DTC Profitability 2026 benchmarks payback by business model, and the ranges are denominated in gross profit contribution, not revenue: marketplaces recover acquisition cost in 1 to 3 months, subscription brands in 3 to 9 months, and pure DTC brands in 6 to 12 months. The same research documents that fully-loaded contribution margin now ranges from deeply negative on cold paid social acquisition to strongly positive on email and SMS retention. That spread makes a single blended CAC number across channels close to meaningless; the only way to make sense of acquisition spend is to break it down to GM$O by channel.
Grove's own filings show why this matters even when revenue per order looks stable. The gap between a 3-month payback and a 9-month payback at the same acquisition rate is a permanent working capital drag, and it is the kind of gap that sends a brand looking for a funding round it should never have needed to raise.
The standard objection is that ROAS has worked for years and brands know how to run it. A high ROAS and a negative GM$O-adjusted return can coexist on the same campaign report.
Product mix sorted by GM$O instead of revenue contribution
The 2026 public benchmark shows e.l.f. Beauty running at a meaningfully higher gross margin than Vital Farms or Beyond Meat, and that gap is not purely an operations story. Category-level input costs and pricing power set the GM$O ceiling before operational execution even enters the picture, so product mix is a decision that happens structurally prior to operational decisions, not downstream of them.
Promotional depth compounds this. Revenue contribution flatters the first SKU and ignores the second.
Returns reserves belong in this same analysis and are frequently left out of it.
How GM$O changes the conversion calculus for a pre-qualified buyer's worth
Once GM$O is known at the SKU and order level, converting a given visitor has a calculable value rather than a blended average, a number a brand can calculate for that specific visitor, on that specific product, through that specific channel. That number changes how much it makes sense to spend on on-site conversion tools, because not every conversion is worth the same amount. A visitor arriving through a high-intent channel and landing on a high-GM$O product is worth more to convert than a promotional-email visitor landing on a discounted bundle, even when both visitors show the same revenue potential on paper.
The Ecom CFO benchmarks show that contribution margin runs substantially lower for large brands than for small ones, even though the large brands often post higher gross margins. If a conversion tool raises average order value on the same fulfillment footprint, it improves GM$O directly. But if a tool just drives more low-value orders through that same fulfillment footprint, GM$O can get worse, even while order volume and revenue both rise.
The same benchmarks show ROAS declining as brands scale, so the marginal order costs more to acquire even when gross margins hold steady. On-site conversion improves GM$O without raising CAC. It is the one lever that reduces payback period and increases margin per order at the same time.
AI-assisted on-site interaction fits into this calculus for a specific reason: it operates on the same logic as the rest of the GM$O framework. A shopper who arrives with a specific product question, and gets that question answered directly by a brand's own AI, has already compressed the buying journey that would otherwise require a discount or a customer-service intervention to close. That compression lowers the conversion cost on the order in time, in discounting, in service load, and a lower conversion cost means a higher GM$O on that order relative to an equivalent order that needed heavy discounting or manual service to close.
Setting up the P&L for GM$O-based thinking
Running a brand on GM$O as the operating unit requires two structural changes to how most DTC P&Ls get built. The first is correct COGS scoping. The second is to build a per-order or per-SKU contribution view in place of a single blended P&L.
Correct COGS scoping means keeping product cost, inbound freight, customs duties, warehousing labor tied to inbound, and inventory shrinkage inside COGS, and keeping everything else out of it: outbound shipping, merchant fees, pick-pack-ship, reverse logistics are variable selling costs, not COGS. The Ecom CFO benchmark methodology is explicit that fulfillment costs do not belong in COGS, and brands that load them there understate gross margin while simultaneously misstating GM$O. The Ecom CFO benchmarks publish gross margin, contribution margin (gross profit minus variable selling costs, where variable selling costs include ad spend, merchant fees, pick-pack-ship, and reverse logistics), and EBITDA as three distinct layers. That layered architecture is what makes GM$O calculable. Collapsing those layers together conflates the gross margin calculation with the contribution margin calculation, leaving both unanswerable.
A blended P&L produces exactly one gross margin number for the entire business, which hides everything the business needs to know about individual orders, channels, and SKUs. To build the per-order or per-SKU view, you break that single number apart by channel, by product, by acquisition source, by promotional status. Private brands can build the same view from their own order management and accounting systems; they do not need to invent new infrastructure.
Returns need to be reserved against revenue at the time of booking, not expensed at the moment of refund. Tariff exposure belongs inside COGS for the same reason: customs duties vary enormously by category and sourcing country, and a brand that does not model those duties into per-order COGS is running a GM$O figure that will shift materially the moment trade conditions change. It is a structural accounting practice that tariff volatility simply makes more urgent to get right now.
Once the P&L is restructured along these lines, correct COGS scoping, a reserved returns line, tariff exposure built into per-order COGS, and a per-order or per-SKU contribution view, the decisions that follow from GM$O stop being a judgment call and start being close to mechanical.
Three decisions that change when GM$O is the unit: acquisition budget, channel mix, and discount authority
A brand running on GM$O makes different decisions on acquisition, channel allocation, and discounting than a brand running on revenue or ROAS, because GM$O makes visible the trade-offs that revenue and ROAS were built to obscure.
Acquisition budget becomes a calculable ceiling rather than a negotiated guess: GM$ per order divided by the target payback period in orders gives the maximum allowable CAC for each product or order type. The State of DTC Profitability 2026 found that CAC follows a U-shape by revenue stage, worst for the smallest brands and worst again for mid-market brands in the several-million-dollar revenue range, around $75, easing only once a brand reaches the largest scale. That shape means mid-market brands are frequently paying the highest CAC relative to their own GM$O, and they stand to gain the most from tightening that ceiling.
Channel mix shifts once contribution margin, not attributed revenue, becomes the allocation criterion. As AI shopping channels build out their own fee structures, brands will need to model GM$O net of those fees the same way they already model GM$O net of Amazon fees against direct DTC. A channel can post a strong ROAS and still carry a fee structure that compresses GM$O below the threshold needed to recover acquisition spend.
Discount authority is the clearest place where the revenue-based and GM$O-based frameworks diverge in practice. If a brand sets discount authority at the revenue level, approving a promotion because it drives order volume or top-line revenue, it can end up approving orders that fall below the GM$O threshold it needs to recover its own acquisition cost. So the fix is to build discount authority tables on GM$O floors by SKU, not on revenue or average-order-value targets. A deep discount on a high-margin SKU may still clear that floor comfortably; the identical discount on a low-margin SKU may fail to clear it. Grove's Q4 2024 filing shows exactly this mistake playing out in a real quarter: increased promotional activity drove the gross margin decline from the prior quarter, while revenue per order held essentially flat. The brand ran more orders at a lower GM$O and the revenue line never flagged it.
Acquisition budget, channel mix, and discount depth are, right now, decisions most DTC brands are making on metrics that obscure the one number that shows whether any of it builds value. Switching the unit from revenue or ROAS to GM$O does not require new data collection or new infrastructure. It requires reframing the data a brand already has around the denominator that actually answers the question being asked.