ROAS vs MER vs nROAS in DTC Reporting
Three metrics reveal what platform dashboards hide about your actual profitability.

A brand can watch its ad dashboard turn green every morning while its bank balance quietly shrinks, and the two facts are not a contradiction. They are the predictable outcome of anchoring every spend decision to one number, almost always platform-reported ROAS. So brands overspend on paid acquisition, and the signals that would reveal real trouble stay buried outside the dashboard's field of view. Platform ROAS earns its place at the top of every ad manager because it is the figure the platform chooses to surface first, and teams end up managing toward visibility rather than toward profit.
The mechanics behind that distortion are structural: Meta, Google, and TikTok each attribute conversions independently, with no coordination between them, so a single customer who clicks a TikTok ad, clicks a Meta ad three days later, and converts through a Google branded search on day five can generate three separate attributed conversions for one actual sale. Summing ROAS across platforms routinely double-counts revenue the store only booked once. Privacy changes have made the picture worse: since mobile operating systems began requiring user permission for tracking, standard pixel tracking captures only a fraction of real conversions, and the ongoing deprecation of third-party cookies is expected to break the majority of attribution setups brands currently rely on. It is now common to see significant variance between what Meta Ads Manager reports and what GA4 reports for the same period, and neither figure reconciles cleanly to actual revenue.
The cost of this drift is not confined to reporting error. Brands that measure only ROAS, instead of tracking what the business actually returns on its marketing investment, systematically overspend on paid acquisition, because the dashboard keeps telling them the channel is working even as the P&L tells a different story. None of this is an argument for abandoning ROAS. It is an argument for understanding precisely what question ROAS answers and where that question stops being useful. That is where the rest of this stack begins.
What ROAS measures
ROAS deserves credit for what it does well before any critique of its limits. It is calculated simply, attributed revenue for a channel divided by ad spend for that channel, and most platforms generate it automatically without any extra instrumentation required. Inside a single platform, it answers a genuinely useful tactical question: which ads and audiences does the platform believe are working right now? That makes it the right tool for creative testing, for diagnosing when a campaign has fatigued, and for comparing one audience against another within the same channel.
Its usefulness stops at the edge of that tactical lens. ROAS counts attributed revenue, so it claims every sale a platform can plausibly take credit for, whether or not the ad actually caused the purchase. It has no visibility into cost of goods, fulfillment costs, returns, or payment processing fees, so a campaign can post an impressive ROAS and still lose the brand money once those real costs land on the order. Retargeting and remarketing campaigns compound the distortion further: they almost always show stronger ROAS than prospecting campaigns because they reach shoppers who were already close to buying, often as a direct result of brand-building the business paid for elsewhere. The platform collects credit for demand it did not create. As spend scales, ROAS can continue to look healthy even while overall profitability erodes, a blind spot that grows more dangerous the faster a brand is trying to grow.
You calculate blended ROAS as all revenue divided by all ad spend across channels, and it corrects some of the double-counting, giving a more honest figure than any single platform's self-reported number. A scaling DTC brand in a healthy position typically shows a blended ROAS in a moderate multiple range, but the exact figure shifts meaningfully depending on category margin. Even blended ROAS cannot answer whether the company's total marketing investment, not just its ad spend, is efficient. ROAS only sees ad spend. It has no denominator for the rest of what a brand spends to generate revenue, and that gap is where MER becomes necessary.
What MER measures that ROAS cannot
MER, or marketing efficiency ratio, answers the question ROAS structurally cannot ask: is total marketing investment efficient? It divides real total revenue by real total marketing spend, figures that reconcile to the bank account rather than to a platform's self-reported attribution. Because it cannot be inflated by any single platform's attribution logic, finance and growth leadership trust it in a way they rarely trust a channel-level ROAS figure. MER also captures effects that ROAS is structurally blind to: cross-channel halo, brand-building, organic traffic lift, influencer spend, and awareness campaigns all flow into the denominator as cost and into the numerator as the revenue they eventually produce.
What makes MER operational, rather than just a tidy ratio, is break-even MER, which you calculate as 1 divided by contribution margin. That figure is the floor below which every dollar of marketing spend loses the business money, and no DTC operator can interpret a MER reading without knowing where that floor sits. Median DTC contribution margin fell significantly between 2021 and 2025, and it landed around 22% in 2025 as paid acquisition costs climbed. When margin compresses, break-even MER rises, so a campaign that was comfortably profitable two years ago can be running underwater today, with no change to the ads themselves. MER only tells the truth if "total marketing spend" is built honestly: media spend across paid social, search, affiliates, and retail media; performance-tied agency retainers; and creative production costs where they represent a real input to growth. Leaving any of those out flatters the ratio and hides the same kind of overspend that platform ROAS was hiding.
MER's own blind spot sits right behind its greatest strength. Because it blends revenue from both new and returning customers, a brand can post a healthy MER while its prospecting campaigns are failing outright, because loyal repeat buyers are quietly subsidizing weak new-customer acquisition, and the blended figure gives no indication that this is happening. A second gap works in the opposite direction: MER includes organic purchases and word-of-mouth revenue simply because those transactions occurred, even though no marketing spend drove them, which can overstate marketing efficiency when organic demand happens to be strong in a given period. That masking problem grows sharper when a brand cannot tell which traffic arrived through organic discovery, paid channels, or AI-mediated search, because all three get folded into the same blended revenue figure with no way to separate them. Brands that control their presence on their own storefront and across AI shopping surfaces can tag acquisition source with more precision, turning what MER obscures into prospecting data a team can actually act on. That repeat-customer masking is what makes a third metric necessary.
Why nROAS (aMER) matters for sustainable growth
New Customer ROAS, also tracked as acquisition MER or aMER, is the only metric in this stack built to answer a single question directly: is the brand buying net-new growth, or recycling revenue from customers it already won? The two framings measure the same underlying idea from slightly different angles. nROAS divides new customer revenue by ad spend, isolating how much of what the platform attributes actually came from first-time buyers. aMER divides new customer revenue by total ad spend rather than attributed spend, making it more resistant to the attribution gaps that distort platform ROAS. Whichever framing a team adopts, the value lies in what the number reveals, not in which label a given team prefers.
A brand can report a healthy 4x blended ROAS while its true cost to acquire a new customer is underwater, because returning customers convert at far higher rates and quietly subsidize weak prospecting spend. Repeat buyers do not require the same acquisition investment that new customers do, so crediting ad spend with their revenue inflates every blended efficiency number upstream and hides whether growth is genuine. aMER forces a question most brands would rather avoid: is the business actually buying growth, or just recycling demand that already existed?
The dimension that matters most inside this metric is the marginal one. A sound scaling plan depends on marginal aMER, the new-customer revenue produced by the next dollar of spend, which can look perfectly healthy as a blended average even after the marginal return has slipped into diminishing territory. As spend scales, aMER typically declines, and that decline is information about where the brand sits relative to the point at which new-customer growth stops being profitable. Reading that signal clearly requires standardized reporting: prospecting against retargeting ROAS, branded against non-branded search, and new-customer against returning-customer revenue, split consistently across every platform. Clean cohort separation of this kind depends on knowing, at the point of entry, which customers are genuinely new, and that precision is only as good as the infrastructure capturing first touch. Brands running their own AI sales presence across both their storefront and AI discovery surfaces can instrument new-customer conversions at the moment a shopper arrives, whether that shopper came through a direct visit, an AI agent query, or a conversational search tool, giving nROAS calculations the clean inputs they need before a brand commits more budget to scaling. So once prospecting and retargeting are separated cleanly, the question that remains is whether the brand has already crossed past the zone where the next dollar still pays for itself.
Reading the three metrics as a diagnostic stack
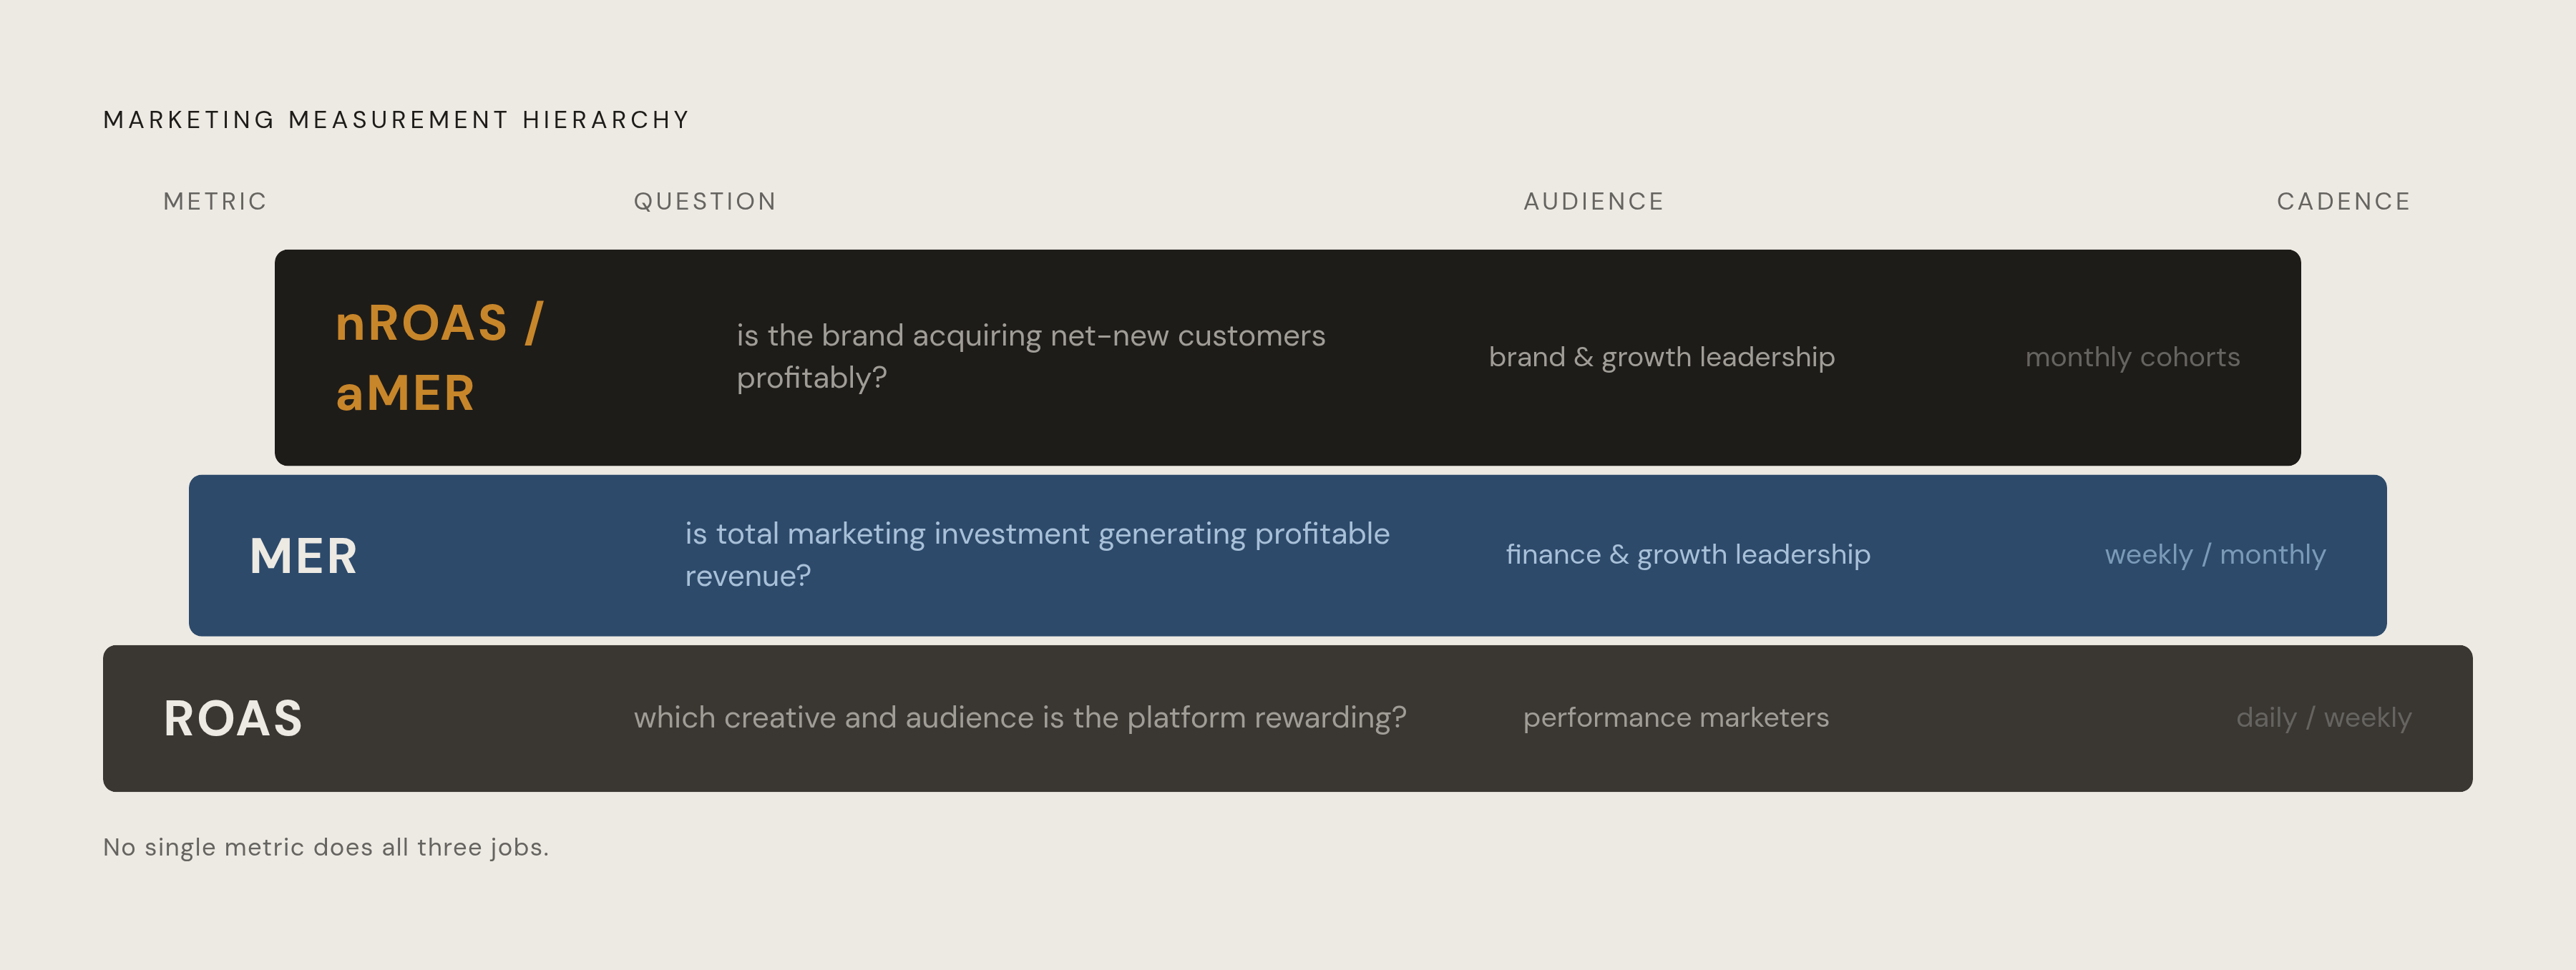
If a brand starts reading the gaps between these metrics as signals rather than as reporting noise, they turn into a genuine diagnostic system. Each one operates at a different altitude, answering a different question for a different audience on a different cadence. ROAS sits at the campaign and channel level, it answers which creative and audience the platform is currently rewarding, and it belongs to performance marketers who review results daily or weekly. MER sits at the business level, answering whether total marketing investment is generating profitable revenue, and it belongs to finance and growth leadership reviewing results weekly and monthly. nROAS and aMER operate at the growth-quality level, answering whether the brand is acquiring net-new customers profitably, a question that belongs to brand and growth leadership reviewing cohorts monthly.
Four recurring scenarios show what the gaps between these layers actually mean in practice. When MER stays healthy but ROAS declines, the likely explanation is attribution undercounting rather than a real drop in performance, so the right first move is to check for tracking changes and conversion lag before cutting any spend. When ROAS looks strong but MER falls, the platform is probably rewarding retargeting and branded search while incremental reach has stalled, a pattern often tied to demand capture or promo dependence, and the right response is to split prospecting from retargeting ROAS and review both discount depth and contribution margin per order. When MER stays healthy but aMER is weak, repeat buyers are masking a real problem in acquisition: prospecting is underperforming, the blended number simply flatters it, and no budget decision should be made until new and returning revenue get separated. When both MER and ROAS drop together, the two lenses agree that something real has broken, and the fix belongs on the operational side, in onsite conversion rate, average order value, CPM inflation, or creative velocity.
Those four scenarios point toward an operating cadence that separates teams optimizing a dashboard from teams optimizing an actual business: use ROAS to steer creative, bids, and audience structure day to day; check MER weekly to confirm the business is actually benefiting from that work; and investigate any sustained gap between MER and aMER before shifting budget based on either number alone. Contribution margin is the variable that moves the goalposts for all three metrics: break-even MER rises as margin falls, so a brand has to recalculate its own target MER every time margin shifts, because the same spend that was profitable at a higher margin can turn unprofitable purely from margin compression, with no change to the campaigns themselves. None of the three numbers means much unless the inputs behind them are locked down in advance: whether "revenue" is counted gross or net, how returns and discounts get timed into the calculation, and exactly which costs enter the marketing spend denominator. Keeping those choices consistent is what lets the stack track trends over time, even if a single day's figure is not exactly right.
Where the full stack breaks down
Even a brand running all three metrics correctly, with clean inputs and disciplined cadence, still runs into a gap the stack cannot close on its own: incrementality, the question of whether the spend actually caused the sale. Platform ROAS credits every attributed sale, even purchases that loyal customers would have made whether or not they ever saw the ad. Incremental ROAS asks a narrower and harder question, measuring return only on the sales that would not have happened without the spend, typically by comparing results against a holdout group that saw no ads.
That gap affects ROAS, MER, and nROAS alike. All three can report healthy numbers while a meaningful share of the "revenue" they count would have shown up anyway, through brand loyalty, organic search, or word of mouth that no campaign actually produced. Closing that gap requires a level of experimentation, holdout testing, and data discipline that goes beyond what dashboards report by default, and it becomes harder still as a growing share of shopper discovery moves through AI-mediated surfaces, where a conversation with an AI shopping agent or a conversational search result may influence a purchase long before any platform's pixel fires. A brand can measure what actually happened, rather than what a platform claims happened, only if it increasingly controls the data itself rather than relying on what a third party chooses to report back. That is the next frontier for honest measurement in DTC: not a fourth metric to add to the stack, but better instrumentation of the moments, including AI-driven ones, that the first three metrics were never built to see.