Revenue Sensitivity Models for DTC Conversion Lever Changes
Rank DTC conversion investments by their actual revenue impact, not gut feel.

Revenue sensitivity modeling helps DTC operators rank conversion investments by how much revenue they are likely to bring in. Compare achievable improvements by the return each produces on its cost. To compare them, the model uses the brand’s own baseline for checkout friction, product page quality, AI-referred traffic intent, and on-site guidance.
Why intuition-based conversion investment leaves DTC revenue on the table
Most DTC brands sequence conversion investments by gut feel, the loudest internal advocate, or last month’s A/B test. A small gain from a high-sensitivity lever can affect every order it touches, but spending a lot on a low-sensitivity lever barely changes revenue. DTC brands face no shortage of plausible improvements and lack a common basis for comparing them.
AI-referred traffic makes that gap more consequential. Its distinct behavior and conversion profile mean that a model built only around historical organic and paid traffic can misread the value of current opportunities. An investment that made sense for the old traffic mix may no longer be the best place to start. Operators need a model that reflects the shoppers arriving now.
What a revenue sensitivity model actually is and why it fits DTC conversion work
A revenue sensitivity model estimates how much projected revenue changes when a particular variable moves by a meaningful increment. It starts with the brand’s own numbers and varies one input while holding the others constant. The sensitivity slope shows how much revenue changes as the input moves. A steep slope means a small input change produces a large output change, while a flat slope means the same input movement produces relatively little revenue.
The basic revenue relationship is multiplicative, with sessions multiplied by conversion rate and average order value, or AOV. Return rate then affects how much revenue the brand keeps, and repeat purchase rate matters when the model covers purchases after the first. Because traffic volume, conversion rate, and AOV interact, simultaneous positive changes can produce more revenue than the sum of their isolated effects. That interaction is a reason to model the inputs separately before considering them together.
Industry averages cannot establish a brand’s position on these curves. The same proposed improvement can have different value depending on the starting conversion rate, traffic mix, and remaining room for improvement. Holding other variables constant makes each lever’s effect legible.
Building the baseline: the four numbers every sensitivity model requires before anything else
The initial baseline requires four numbers, namely sessions, conversion rate, AOV, and return rate. Together, they describe the volume of opportunity, the share that becomes orders, the value of those orders, and the returns that reduce realized revenue. Repeat purchase rate becomes part of that baseline when the analysis covers purchases after the first. Keeping that distinction clear prevents an initial-order projection from silently becoming a claim about longer-term value.
These numbers must be segmented by traffic source. In GA4 or the brand’s analytics tool, create an AI-referred cohort using source/medium values containing known AI referrers. Keep that cohort separate from organic and paid traffic, and work out the baseline measures for each source group to preserve differences that a site-wide average would conceal.
AI-referred sessions begin on product pages at a far higher rate than organic search sessions and show longer time on site, more pages per visit, and materially higher revenue per visit than non-AI traffic. If the AI-referred cohort also has a lower return rate, its contribution is greater than gross conversion performance alone suggests. The model’s output is only as reliable as the segmentation of this baseline.
Lever one: checkout friction, and why it sits at the top of most sensitivity slopes
Checkout friction usually deserves an early place in the model because it affects every would-be buyer who reaches checkout. AI-referred shoppers can increase the value at stake because their higher purchase intent makes them more likely to reach that stage. Friction then threatens a disproportionate share of high-intent sessions.
To model the opportunity, hold traffic volume and AOV constant and vary checkout completion rate in increments. When the scenario tests checkout alone, the pool that reaches checkout also stays the same. The revenue curve then shows the value of completing more purchases from that pool. A low completion rate can leave substantial room for achievable gains, while a checkout already near its ceiling offers less room to move.
That distinction matters when interpreting the slope. The decision depends not only on the revenue value of a completion-rate gain, but also on how much improvement is realistically available. Potential friction sources include forced account creation, payment method gaps, checkout page load speed, shipping cost surprise, and multi-step form length. The team can estimate how much each could improve before engineering work begins. The model establishes whether checkout merits investment before the team selects the tactic.
Lever two: product page quality and the revenue cost of a page that cannot answer a question
Product page quality has two distinct effects on revenue sensitivity. It affects whether a shopper converts after arriving and whether an AI shopping agent can describe the product accurately before the visit. These are related effects, but they act at different points in the purchase process. Treating them as a single conversion-rate improvement would obscure where the expected revenue comes from.
For the on-site effect, the model concerns the conversion response among shoppers who encounter the page. When a page leaves a purchase question unanswered, the shopper still has a decision to make. Better product information matters to the extent that its added detail closes that gap. The relevant revenue opportunity is therefore the change in purchase completion associated with a page that answers what the shopper needs to know.
The pre-arrival effect belongs partly to the traffic side of the model. If an AI shopping agent cannot accurately represent a product, the brand can lose consideration before there is a session to convert. This makes product page quality a bridge between conversion work and AI-referred traffic growth. Its projected value should distinguish improved conversion among existing arrivals from any expected change in the arrivals themselves.
Lever three: AI-referred traffic intent, and how its distinct conversion profile changes the sequencing math
The next lever changes the question from converting existing traffic to growing the cohort with the strongest purchase intent. AI-referred shoppers arrive later in their decision process, with purchase decisions already partly made by the model that referred them. They are not simply organic search visitors with somewhat better metrics. Their position in the decision process gives the cohort a different economic profile.
When the brand’s baseline shows significantly higher conversion rates and AOV for AI-referred sessions than for the blended average, increasing those sessions can produce a steep revenue slope without any on-site conversion improvement. The model keeps the cohort’s conversion rate and AOV the same while changing its volume. That isolates the revenue value of growth from the value of converting each visitor better. Whether it becomes the highest-return investment still depends on the cost of acquiring that growth.
The opportunity also depends on what happens before a referral. AI shopping agents assess products from different merchants, compare their attributes, and start or complete transactions in a single conversation. Weak structured data can therefore cost a brand consideration at the agent-evaluation stage. That loss precedes the on-site funnel. A model concerned only with conversion after arrival therefore misses part of the investment decision.
Lever four: on-site guidance and the measurable conversion gap between assisted and unassisted sessions
On-site AI guidance is a discrete conversion lever because it changes the conversion-rate input for the sessions it touches. The model separates assisted and unassisted sessions. Its key variables are the share of sessions receiving guidance and the conversion-rate differential between the two groups.
The mechanism is completion of an unresolved decision. An AI-referred shopper may arrive largely decided but still need an answer about fit, compatibility, shipping policy, or an ingredient. When a static product detail page cannot resolve that question, on-site guidance can supply the missing answer within the session. Without it, lacking the answer needed to decide can lead the shopper to abandon the purchase or search for a competitor.
Model this lever by varying the assisted share from its current level to a higher target, then varying assisted conversion relative to unassisted conversion. The first change tests the value of helping more shoppers, and the second tests the value of giving better help. The comparison shows which variable accounts for more of the projected revenue gain. An observed conversion gap supplies a modeling input, but it does not by itself prove that guidance caused the entire difference.
How to read the model's output and sequence investments across the four levers
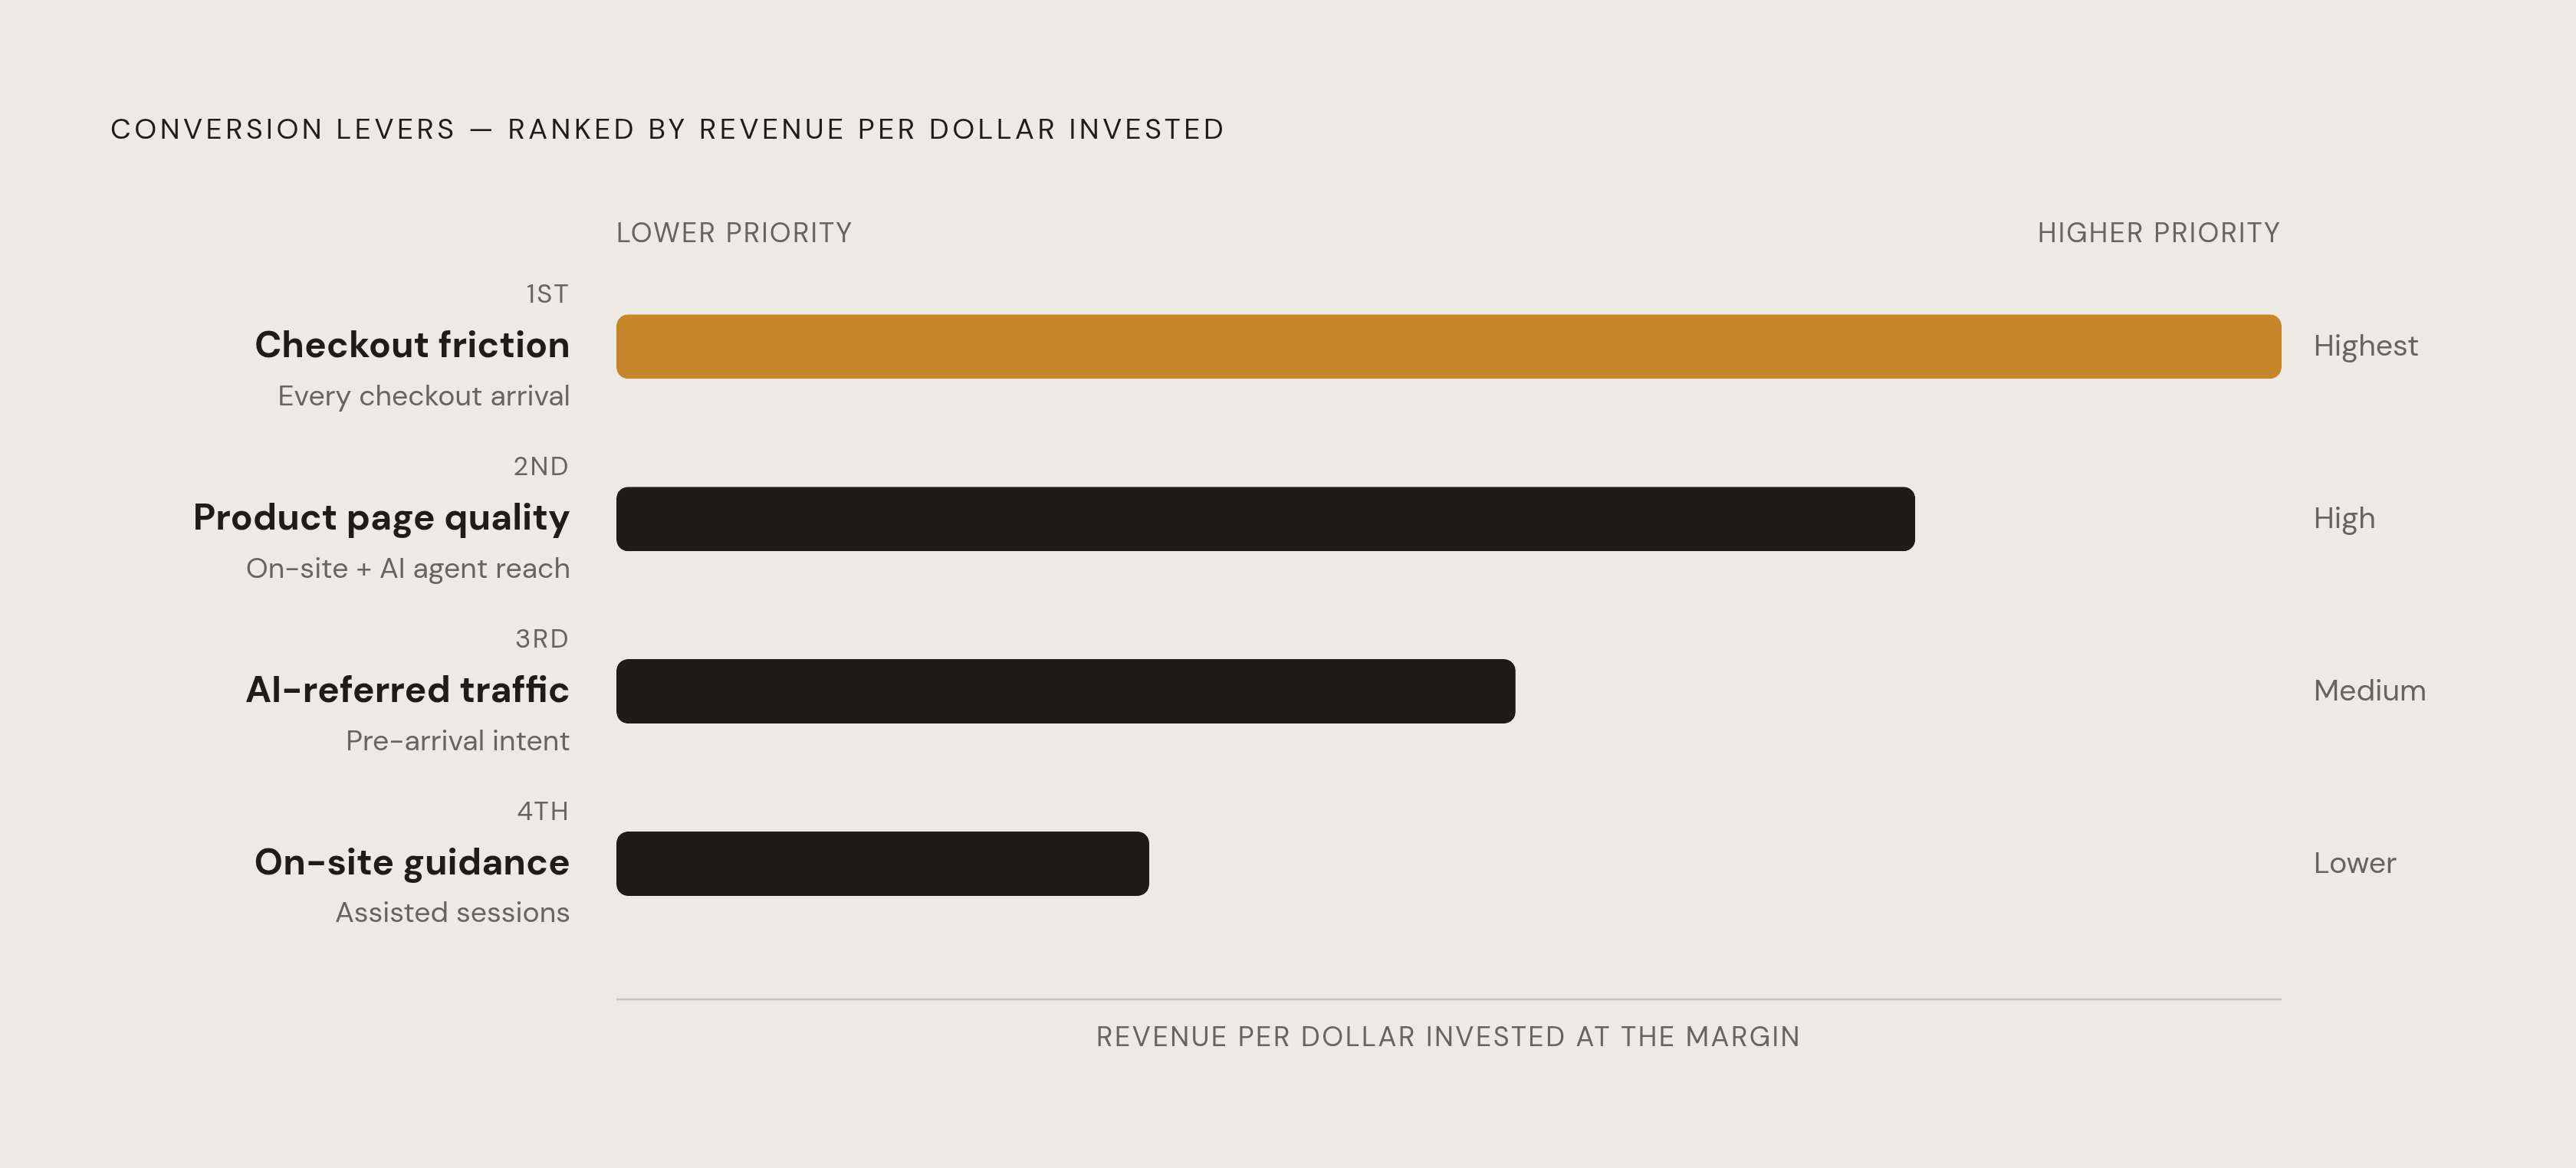
Once each lever has a sensitivity slope, the sequencing rule is to invest first where an achievable movement produces the most revenue relative to its cost. The steepest raw slope is not automatically the best investment if moving that input is expensive. Conversely, a smaller revenue opportunity may deserve priority when it can be reached at much lower cost. The useful comparison is revenue per dollar invested at the margin.
This rule corrects the mistake of buying more traffic before addressing a high-friction checkout. Additional sessions still face the same low completion rate, which limits the revenue gained from growth. If checkout improvement offers a better return on cost, it belongs first. The decision follows from the brand’s modeled constraints rather than a standing rule that acquisition or conversion must always take precedence.
A product page scenario tests the value of better information when shoppers arrive and before referral, while a guidance scenario tests the value of helping shoppers with questions they still have. Each needs its own achievable change and cost estimate. After comparing them on their own, a combined scenario can show how they work together with changes to traffic and checkout. It should not simply add every projected lift as though the levers operated independently.
Measuring the model's predictions against actual results without overclaiming attribution
A sensitivity model produces hypotheses. After an investment, the projected revenue lift must be compared with observed results using a method that isolates the lever. Site-wide conversion before and after a change is not the right comparison unit. The relevant comparison is the cohort exposed to the change against a matched cohort that was not. For AI-referred traffic, conversion rate and AOV should be assessed against a prior-period or holdout baseline for that cohort.
Platform-reported attribution is not a substitute for that evidence. Meta, Google, and email each claim credit through their own attribution windows, so the revenue they claim together can be more than the store actually earns. Validating the model against those totals would carry the same overclaim into the next investment decision. Incrementality testing through geo holdouts, ghost bids, and platform-native lift studies provides causal evidence of channel lift independent of attribution-model assumptions.
AI referral measurement has a separate limitation because GA4 undercounts it. Treating tracked referrals as a floor and supplementing them with a post-purchase survey gives a more honest view of AI-influenced revenue. The survey broadens that view without making tracked referrals a complete measure of influence.
The feedback loop runs from lever prediction to investment, cohort-level measurement, and model update. Repeating it quarterly builds a proprietary view of which inputs remain sensitive and which are reaching diminishing returns. Actual results replace assumptions, improving the next allocation of budget. Starting earlier gives learning more time to compound than waiting for a model that appears certain.