Building a DTC P&L Forecast That Connects Marketing Inputs to Contribution Margin
Connect marketing efficiency metrics to contribution margin before spending the budget.

A DTC P&L forecast becomes actionable when marketing spend, ROAS, and CAC drive the calculations. Building that connection makes every acquisition decision visible in contribution margin before the budget is spent. A drop of one point in ROAS can raise advertising’s share of revenue by roughly 17 percentage points, so marketing efficiency belongs among the key financial assumptions as well as on the dashboard.
Why DTC contribution margin collapsed and what caused it
DTC contribution margin compression since 2021 reflects a structural acquisition problem. Median contribution margin has fallen by roughly a third, with the decline appearing across multiple independent datasets. Brands spending under a quarter of revenue on marketing had contribution margins roughly 3.5× those of brands spending half or more, reflecting marketing intensity’s role in contribution margin compression alongside product cost and logistics. Many brands now have too little contribution left to get through a weak quarter.
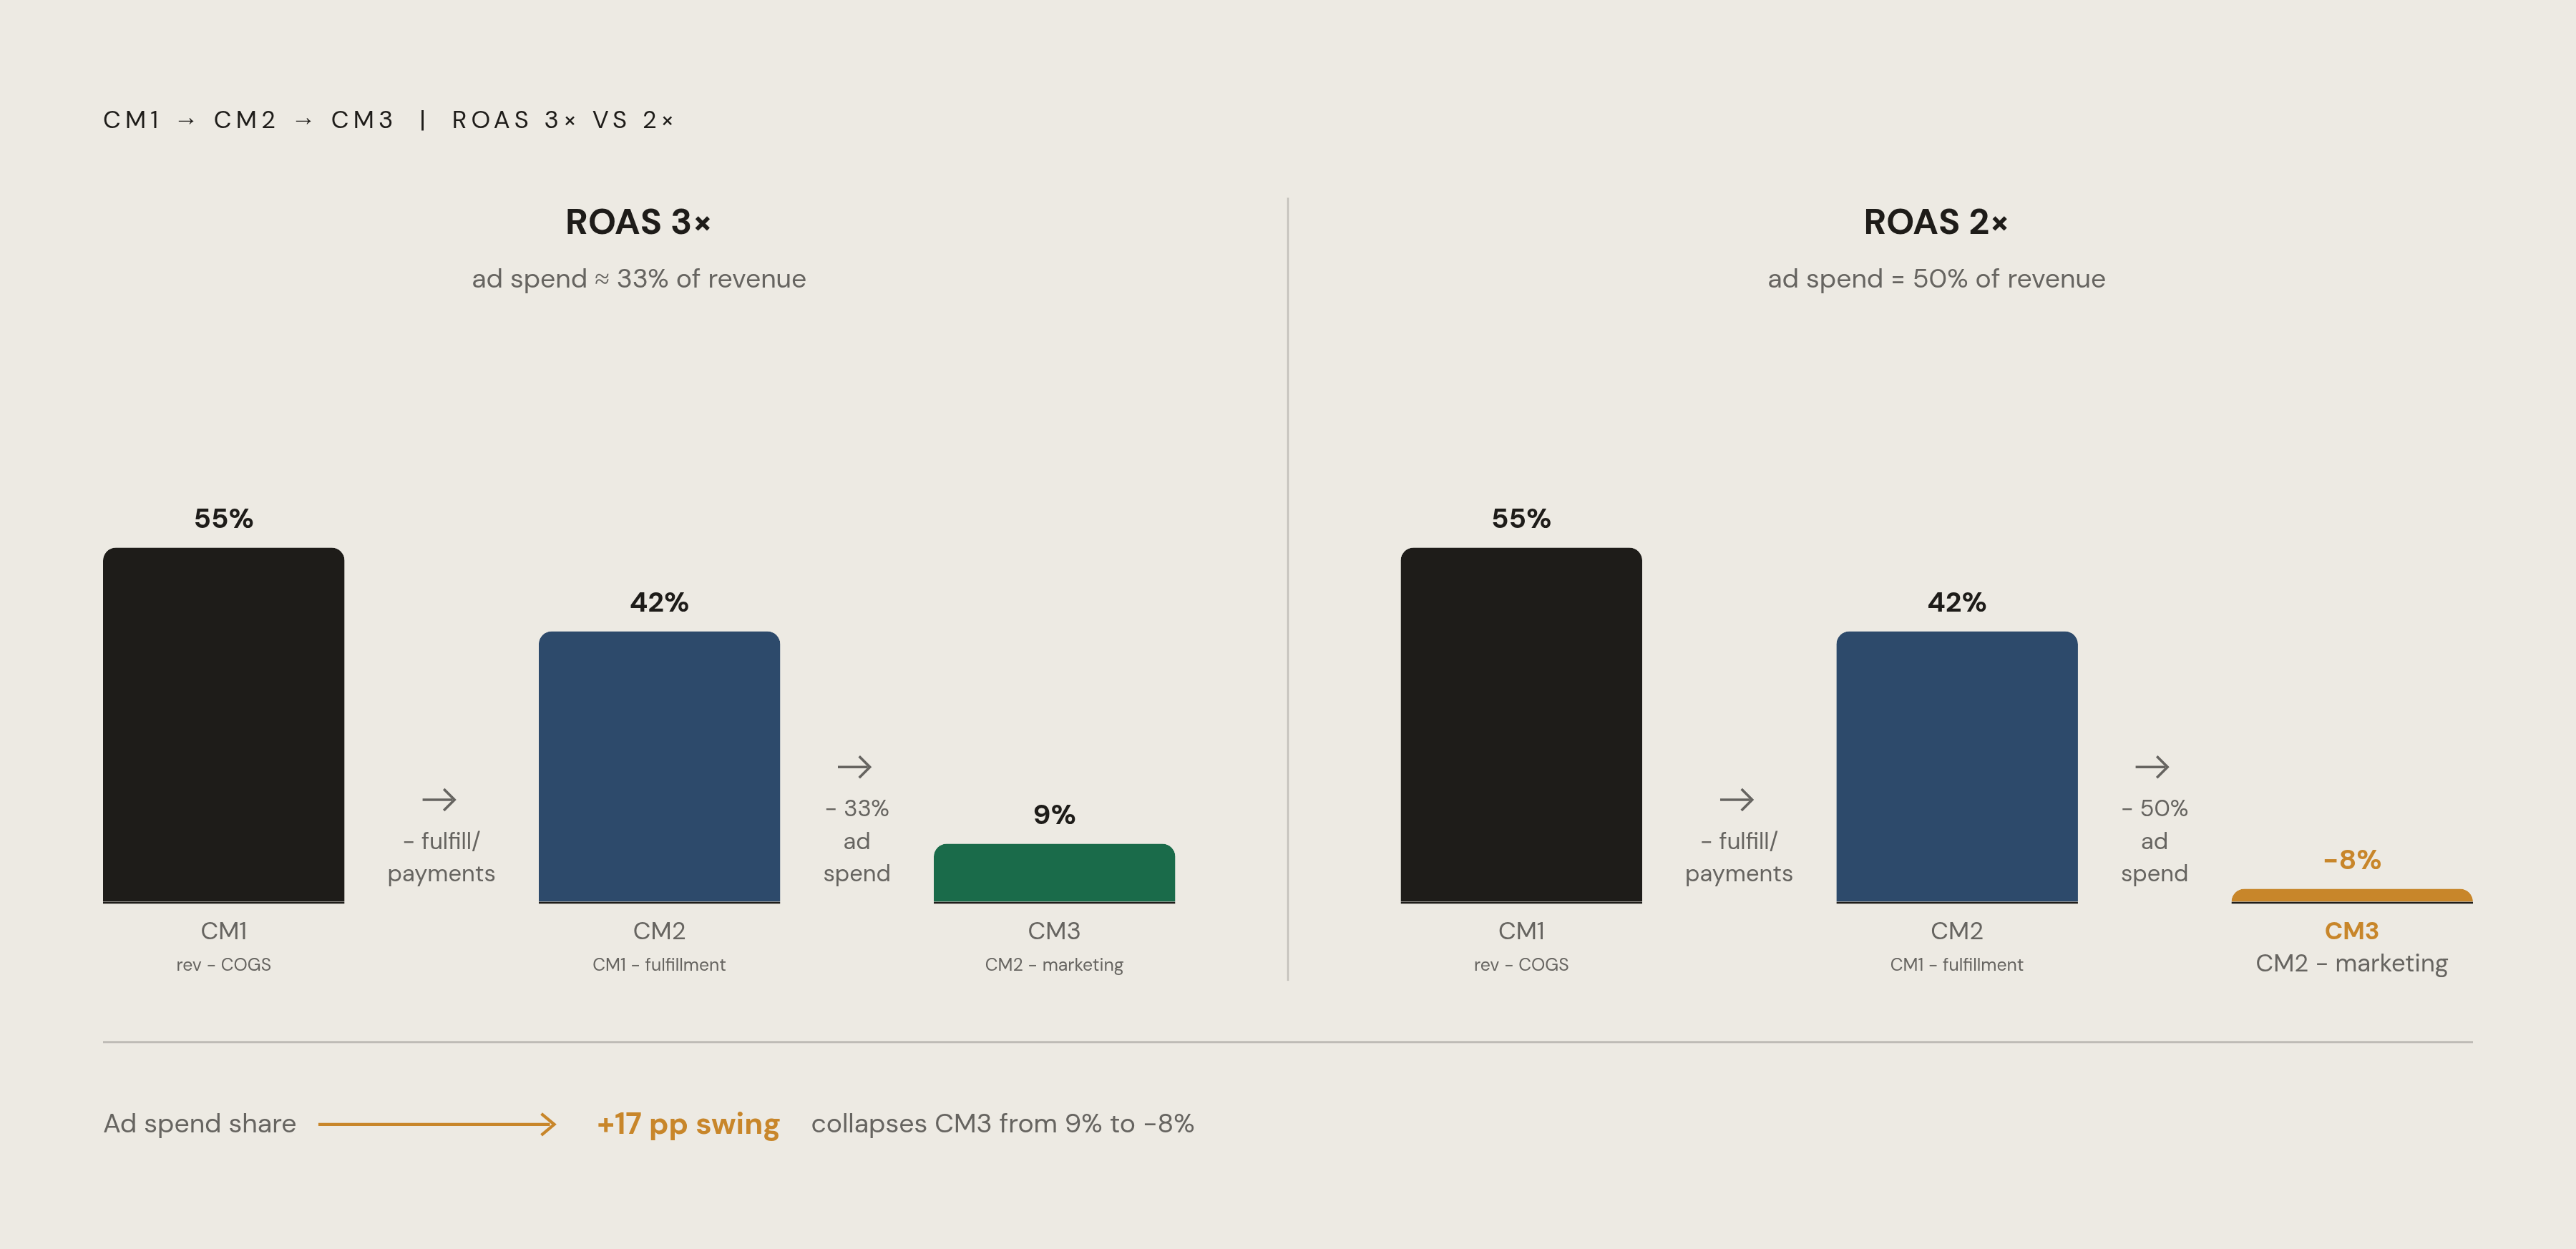
The mechanism is straightforward but financially severe. At 3× ROAS, ad spend consumes roughly a third of the revenue attributed to it. At 2×, it consumes half. That single-point deterioration increases advertising’s revenue share by roughly 17 percentage points, before any change in product or fulfillment costs. For a marginally profitable brand, the acquisition engine alone can turn contribution negative.
Fulfillment costs compound the pressure, but they are structurally harder to move. Marketing spending is more adjustable, and its relationship to revenue determines how much product margin survives acquisition. No amount of COGS discipline rescues a forecast that leaves marketing spend unmodeled.
How most DTC forecasts are built wrong — revenue first, marketing second
The conventional spreadsheet starts with a revenue target and assigns marketing a percentage of that target. This looks orderly because every expense has a place and the forecast balances. It also conceals whether the business can acquire enough customers at the assumed cost to produce that revenue. The revenue cell is an aspiration. Marketing then becomes a passive residual despite its role as a variable cost in making the target achievable.
The diagnostic is familiar to DTC operators. A team can quote ROAS to two decimal places yet cannot state the contribution margin on a single order. That gap reflects a separation between channel performance and financial performance. In the underlying business, CAC multiplied by new customers determines acquisition spend, while first-order value determines the revenue those customers generate. Repeat rate and order frequency then determine subsequent revenue, rather than emerging automatically from a growth assumption.
A fixed marketing percentage masks those dependencies. When CAC rises, the spreadsheet can retain both its original revenue target and its original spending ratio without exposing the contradiction. A standalone P&L has another blind spot because inventory consumes cash that does not appear as an immediate expense. Accrual profit alone cannot show whether the business can afford its acquisition plan.
The CM1 → CM2 → CM3 waterfall and where marketing belongs in it
The structural alternative is a tiered contribution margin waterfall. CM1 is revenue minus COGS, which establishes the gross margin available to fund the remaining variable costs. CM2 subtracts shipping, payment processing, returns, and 3PL costs from CM1. CM2 is especially useful for seeing how the operations make money before the business pays to acquire customers. CM3 then subtracts variable marketing costs, including paid media, influencer spend, and affiliate commissions.
The placement of marketing is the decisive change. A positive CM2 does not establish that an order remains profitable after the cost of acquiring it. CM3 exposes that distinction by showing contribution after all these variable costs, before overhead and other downstream charges. Marketing is no longer buried in an aggregate margin assumption. Its cost has a visible deduction point, while the revenue it generates flows through the preceding layers.
To put this framework into practice, operators should treat category and stage benchmarks as starting points and replace them with their own actuals. DTC apparel, beauty and wellness, mass CPG, and home and furniture have materially different gross margin profiles. A single hardcoded gross margin rate cannot represent them all. As a brand grows and marketing intensity falls, the gain in EBITDA should likewise come from the marketing driver. Editing a percentage to manufacture that improvement would restore the original forecasting flaw.
Wiring ROAS and CAC directly to the contribution margin cell
As a template, assume a brand has a target number of new customers for the period and fills in CAC from its own actuals. Multiplying that customer target by the corresponding CAC produces required acquisition spend. For the blended calculation, the model uses blended CAC and the target for all new customers, while for the paid-channel calculation, it uses paid CAC and the paid customer target. These populations must remain distinct because blended CAC is materially lower than paid CAC.
Required paid spend multiplied by ROAS produces the revenue assigned to that acquisition engine. Organic and repeat-purchase revenue then go in their own rows and add to total net revenue, with each sale counted only once. Repeat revenue depends on customers acquired in earlier periods, their repeat rate, and when they place their next order. First-order value provides the connection between customer volume and sales, rather than leaving revenue as an independent typed assumption.
The downstream formulas complete the contribution margin calculation. CM1 is total net revenue multiplied by the gross margin percentage that applies. Driver-calculated fulfillment and payment costs are deducted to produce CM2, and the calculated variable marketing spend is deducted to produce CM3. G&A assumptions, EBITDA, and net income then flow from those results. Changing ROAS or CAC now changes the financial output.
The ROAS sensitivity must retain its correct denominator. Moving from 3× to 2× creates the roughly 17-percentage-point change in advertising’s share of paid-attributed revenue described earlier. The change in total-business CM3 also depends on the revenue mix and the variable costs attached to lost sales. When spend stays the same, lower ROAS leaves less revenue to cover costs. At a fixed paid-revenue target, it increases the spend required to reach that target.
Timing belongs in the driver chain as well. The 2025 DTC Mega Report shows that repurchase likelihood is substantially higher in a 30-day window than in a 90-day window. A fixed repeat-rate assumption misses when revenue from customers acquired in earlier periods comes in at zero incremental CAC. Separately, inventory days connect the forecast to working capital. Higher inventory days tie up more cash on the same revenue base, even when the P&L appears unchanged.
Why platform-reported ROAS is the wrong number to put in the model
Ad platforms claim credit for some conversions that would have occurred without the advertising, overstating the revenue their spending caused. Multiple platforms can also claim the same conversion. Adding those attributed revenue figures can therefore produce a forecast of sales the business will not actually generate. Automated ad delivery makes the distinction between reported performance and incremental revenue more important than bid optimization alone.
The lesson is to separate three measurement roles. Platform-reported ROAS should remain a directional trend signal. Incremental ROAS, measured through holdout testing or causal inference, should populate the ROAS cell because it estimates revenue caused by spending. Marketing efficiency ratio, or MER, divides total revenue by total marketing spend. Checking it against CM3 each month gives a P&L-based check on the channel assumptions, though it cannot show how much incremental contribution each channel adds.
Measurement infrastructure makes this work achievable at DTC scale. Triple Whale provides Shopify-native analytics, attribution, and profit reporting. Northbeam offers ML-based multi-touch attribution and an optional MMM+ module at the Enterprise tier, and requires meaningful monthly conversion volume. Rockerbox provides omnichannel attribution that includes offline channels. These capabilities support measurement, but incremental estimates still depend on methods such as holdouts, synthetic controls, causal inference, and cross-channel cannibalization analysis.
Post-purchase surveys provide a separate qualitative check. Asking “how did you hear about us” can reveal purchase paths that modeled attribution misses. This is especially relevant for AI-influenced purchases, which GA4 undercounts. Survey responses complement the model rather than replacing its revenue and spending records.
How AI shopping channels are creating a new cost line and a new CAC dynamic in the forecast
AI shopping assistants introduce two distinct financial effects. They can route high-intent buyers toward purchase at a lower effective acquisition cost, while agent-mediated transactions can introduce a protocol or transaction fee. Shopify’s commerce data shows that AI-referred orders grew dramatically year-over-year in early 2026. AI-referred shoppers also converted at materially higher rates and had higher average order values than organic search traffic. Around half of AI-referred sessions began on product pages, where shoppers were already closer to deciding to buy.
A buyer sent straight toward checkout may cost less to acquire than a paid social buyer who needs multiple touchpoints. That advantage depends partly on whether an assistant can read the brand’s product data and recommends its products. Recommendation frequency is distinct from citation share. Occasional appearances in AI outputs do not necessarily produce meaningful traffic, while higher recommendation frequency can generate measurable attributable revenue.
For forecasting purposes, operators should model agent-sourced revenue as a separate channel row. That row needs its own CAC assumption, its own protocol cost rate, and its own attribution path. The CAC assumption should allow for the channel’s potential to acquire customers at a lower cost instead of using paid social assumptions under a new label. The protocol cost should use the confirmed ACP figure where applicable. GA4 AI-referral segmentation and a post-purchase survey cross-check provide the attribution inputs for assessing whether the channel’s contribution reaches CM3.
Running scenario analysis before the budget is spent
Before they approve the Q1 marketing budget, operators should run three scenarios and check the CM3 cell. The base case uses current blended CAC, with paid CAC retained separately, current incremental ROAS, and current repeat rate. Category-specific COGS, fulfillment, and shipping assumptions remain the guardrails. They should stay grounded in costs even when the marketing result is uncomfortable.
The second scenario reduces ROAS by one point. The model should show the resulting CM3 and whether it falls below the brand’s sustainability threshold. This test exposes how much room the budget leaves for weaker acquisition performance. A thin starting contribution can disappear under a relatively small change in efficiency. The decision therefore depends on the downside the business can absorb.
The third scenario raises CAC into a stressed range and calculates the repeat orders needed to recover acquisition cost. The repurchase rate and timing must support that recovery. The same report places repurchase likelihood at 89% within the first month, with a dramatic decline before the three-to-four month window. That makes post-purchase flow timing a forecast assumption. A recovery plan dependent on late second orders may promise contribution that does not arrive when required.
A CAC spiral appears when higher acquisition costs compress margin, reduce reinvestment, weaken competitive position, and require still more spending. A retention cliff appears when repeat revenue dwindles and paid acquisition must support almost the entire revenue target. Margin compression appears when modest changes in ROAS or CAC remove the buffer against a slow quarter. Each pattern has a different driver, so an unchanged aggregate margin percentage would conceal the developing risk.
Finally, the budget needs a cash test. Inventory must be purchased before the associated revenue is earned, so a Q4 marketing surge can work on the P&L and still create a cash crunch. The three-statement model should therefore test inventory days and payables terms together with marketing timing. The forecast earns its place in budget approval when it makes the cost of a ROAS assumption visible before that assumption becomes a realized loss.