Ecommerce Conversion Rates by Industry and Traffic Source
Comparable stores in your category and channel matter more than any industry average.

Ecommerce conversion rates by industry and traffic source are useful only when they describe a business comparable to your own. The right benchmark accounts for category, purchase-consideration level, channel and device, rather than treating a global average as a performance target. AI referrals and on-site AI assistance add further distinctions, but they require separate attribution and testing before their contribution can be judged.
Why the headline average is the wrong starting point
A brand operator searches Google for “average ecommerce conversion rate” and finds a different number on every tab. The disagreement is not necessarily an error. IRP Commerce, Dynamic Yield and Littledata measure different store populations, while Littledata’s Shopify median is not interchangeable with an average across another platform’s clients.
Dynamic Yield uses visitors rather than sessions, and calculations based on sessions, visitors and pageviews can give three different rates for the same store. Comparing them without identifying the denominator is comparing unlike quantities.
The calendar also changes the comparison. A brand comparing January against an annual average can therefore diagnose a problem that is actually seasonal. A useful reference needs a comparable store population, a consistent denominator and a relevant period before it can support an operational conclusion.
How industry category sets the conversion ceiling before any other variable
Industry category is the strongest starting point because it shapes how much consideration a purchase requires. A low-ticket replenishment purchase and an expensive, deliberative purchase do not face the same decision cycle. Their conversion rates should not be expected to converge. Food and Beverage, Beauty, and Arts and Crafts favour faster decisions, while Luxury, Baby and Child, and Home Furniture involve more deliberation.
Dynamic Yield’s twelve-month benchmark places Beauty and Personal Care at the top of its range and Luxury and Jewelry at the bottom, separated by more than four percentage points. That spread reflects fundamentally different buying conditions. Because those categories use the same month and platform, their rates differ even when measured in the same way.
Average order value is part of the mechanism. Baby and Child’s high average order value helps explain why shoppers take longer to decide than in a category where they buy on impulse. The category label alone is therefore not enough when stores within it sell at very different prices. Purchase consideration, rather than the name of the vertical, explains why the comparison works.
A home furniture store may be outperforming its peers at a rate that would leave a pet supply store underperforming. Stores in the same category form the reference class, and average order value narrows that group.
Why the traffic channel you use is as decisive as the product you sell
Traffic source changes the intent of the people entering that category-specific buying process. The product, price and site can all stay the same while conversion changes sharply with how visitors arrived. Channel mix acts as a multiplier on the category baseline. It changes both the number of visitors who reach the store and the proportion who are ready to buy.
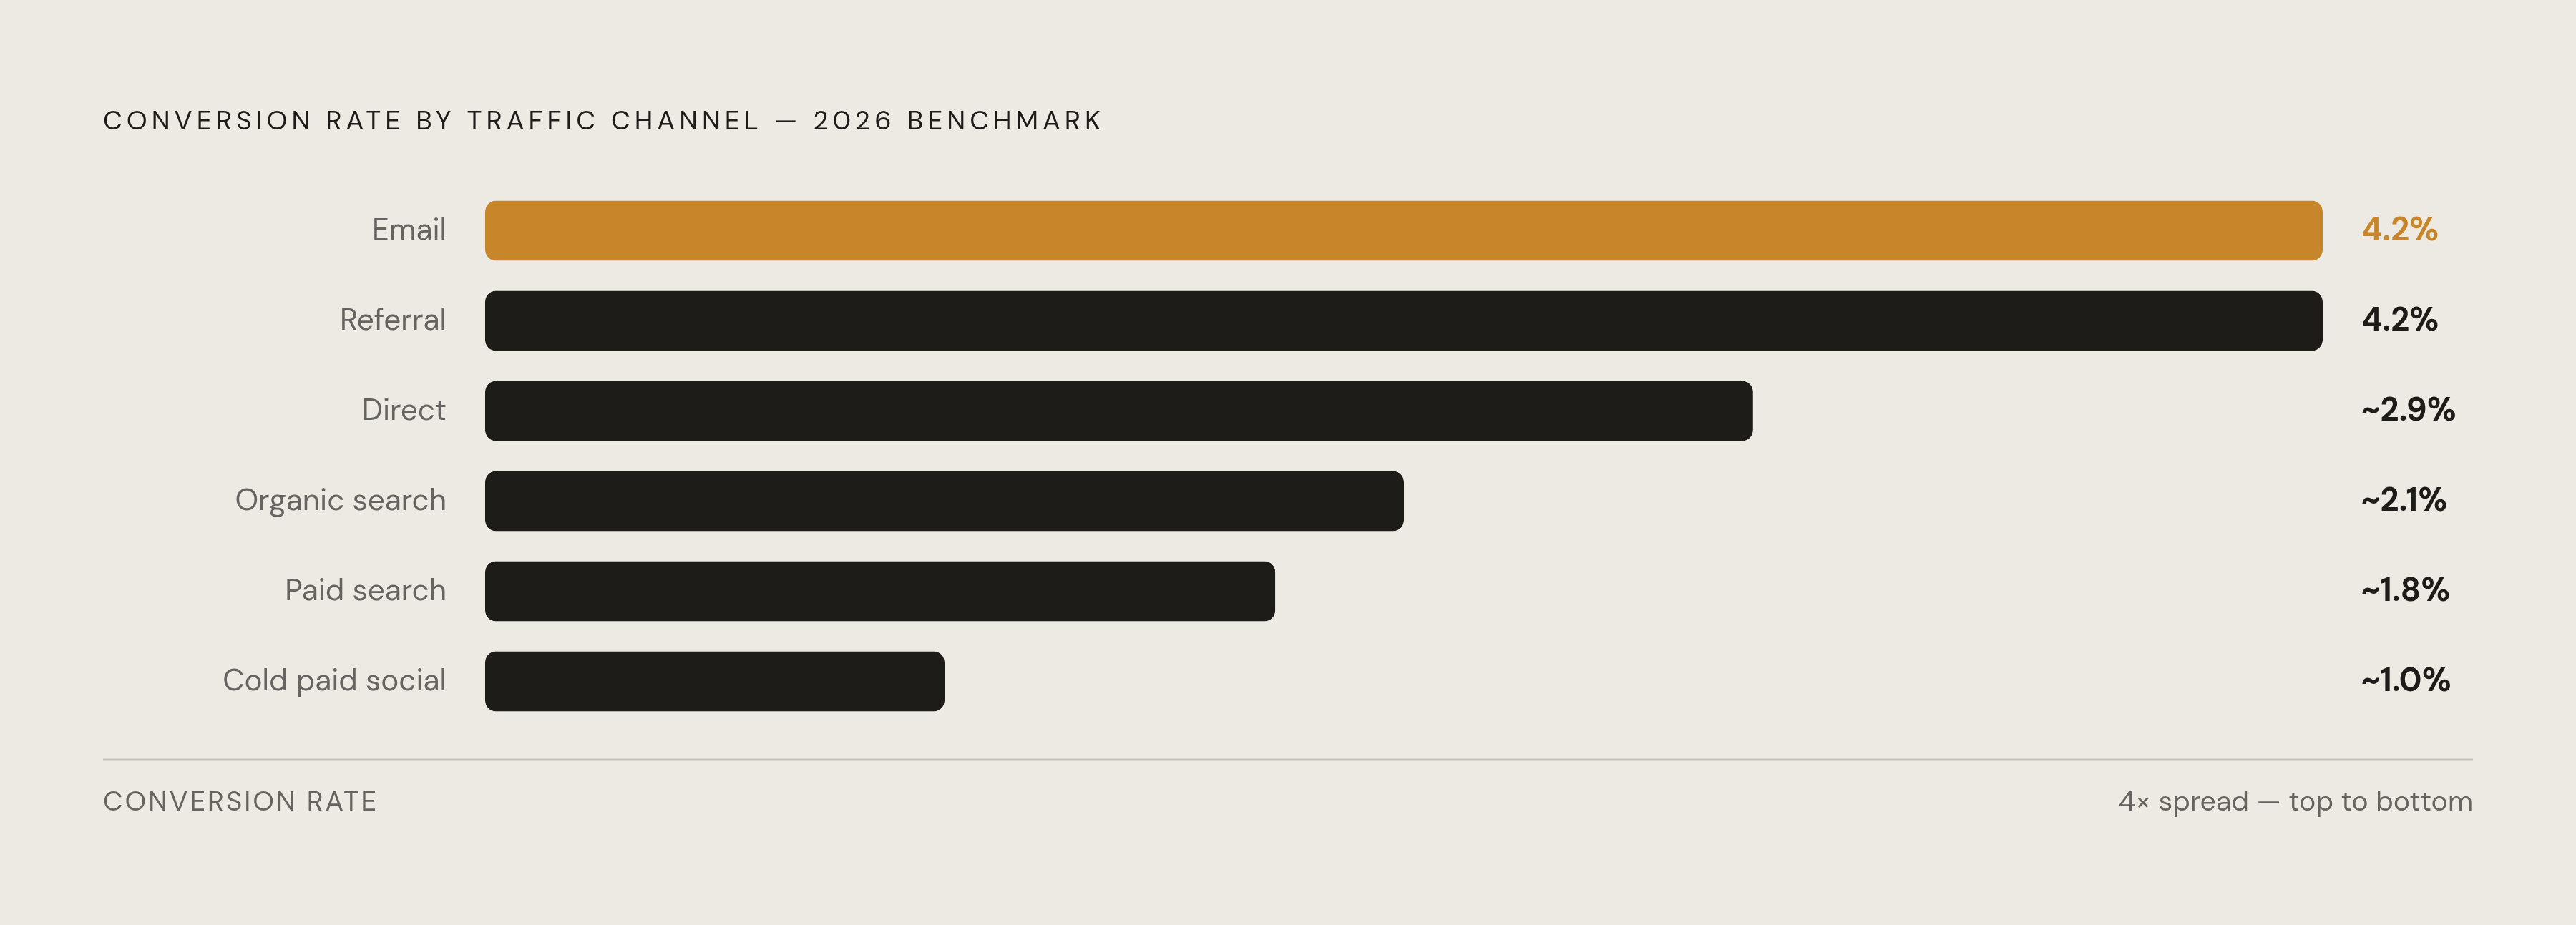
The 2026 benchmark data places email and referral traffic highest at 4.2%, with direct traffic in the middle, organic and paid search below it, and cold paid social lowest. The spread can reach a factor of four or more. Email recipients already know the brand and often arrive midway through a decision. Cold social visitors, by contrast, have been interrupted during a scroll and are entering at the top of the funnel.
Email flows reach customers at different points as they decide what to buy, so even a strong channel has flows that need to be judged separately. Amazon Marketplace is a more fundamental mismatch. Its customers arrive on a trusted platform with reduced purchase friction and stored payment credentials, making its conversion performance an unsuitable target for a DTC store.
For brands scaling paid social, the practical consequence is a potential decline in blended conversion despite an unchanged site. Lower-intent visitors make up more of the total. That scaling pattern alone provides insufficient evidence of failure. Reports should show traffic-source segments whenever blended conversion is used to judge how well a store is doing.
What device split does to your blended number — and what it hides
Device distribution can dilute the blended rate even after category and channel are accounted for. Mobile supplies most traffic for many stores but converts materially below desktop. When more traffic comes from mobile, overall conversion can fall even as the rate for each device improves. Two stores with otherwise comparable traffic can report different blended results simply because their device distributions differ.
Elogic Commerce reports desktop conversion of roughly 3.2–3.9% in its portfolio data, well above mobile. Part of the gap concerns usability. Smaller screens and fiddly checkout create difficulty, but the difference also reflects where a visit sits in the purchase journey. Mobile visitors may research first and complete their purchases later on desktop.
Those visits are counted as separate sessions. As a result, session-based reporting can make mobile look less productive than its role in the decision warrants. The observed gap combines purchase friction with journey-stage differences. It does not establish that every mobile session should behave like a desktop session.
With blended reporting alone, this would look like a failure of conversion-rate optimisation. The practical fix is to report desktop CVR, mobile CVR and blended CVR separately, then diagnose each before deciding what needs to change.
How AI-referred traffic is changing the conversion picture for DTC brands
A first-party analysis of established Shopify stores found that a large majority of AI-referred revenue came from first-time customers, a substantially higher share than across the whole portfolio. That is the clearest signal of its acquisition role. AI referral is not merely another way for existing customers to return. It brings a distinct group into the funnel and needs its own measurement.
Shopify’s Q1 2026 platform analysis reported AI referral sessions growing year-over-year far faster than other channels. It also found that AI-referred sessions beginning on product detail pages converted nearly 50% better than organic search sessions beginning there. The condition is essential to the comparison. The result gives no basis for saying that every AI-referred session converts nearly 50% better than every organic session.
The same analysis found that over half of AI sessions landed directly on a product page, compared with roughly a fifth of organic sessions. That entry point shortens the funnel. However, consumer surveys about having ever used AI while shopping measure something different from transactions or attributable sessions. They cannot establish AI’s share of completed purchases.
Attribution can obscure even the transactions that occur. AI agents frequently bypass or disrupt browser-based tracking, so GA4 can misclassify a large proportion of AI referrals as direct traffic. Standard tracking may therefore show near-zero AI conversions even as orders come in. The prescribed fix is server-side webhook attribution that tags the source at order level before sending the data to GA4.
Last-click attribution creates a further limit. A shopper may decide with AI assistance but buy through a later promotional email, leaving email with the credit. Measured AI share is therefore a lower bound on its influence.
Why AI shopping channels read your product data, not your design
AI-driven discovery depends on whether a shopping system can interpret the product and find strong review signals. Brand awareness and advertising spend do not substitute for that foundation. ChatGPT, Perplexity and Google AI Overviews function as product discovery engines, but their recommendations do not simply reproduce traditional search rankings. Visibility in one system is not proof of visibility in another.
Ahrefs’ research found that a large share of URLs cited by ChatGPT did not rank among Google’s top results. Its findings showed higher, though declining, overlap for Perplexity and Google AI Overviews. Traditional search rank is therefore a poor proxy for AI citation performance. The two need separate optimisation rather than a shared assumption about which pages will be surfaced.
The technical foundation includes Schema.org Product markup, merchant product feeds and crawler access. These give shopping systems structured product information they can use. Most Shopify themes output incomplete schema by default, with omissions including brand fields, GTIN/MPN identifiers and review aggregates. With those fields missing, AI portals may leave stores out of their recommendations.
A store cannot judge the value of AI-acquired visitors from its site design alone if missing product information keeps it out of recommendations. Conversion measurement begins after that opportunity has been created.
What on-site AI engagement does to conversion rates versus the passive site experience
Referral describes how the visitor arrived, while on-site engagement describes what happens during the visit. Shoppers who engage with AI assistance convert at dramatically higher rates than passive browsers. Their behaviour also indicates decision-confirmation mode.
That distinction limits what the higher rate proves. Engaged shoppers are not necessarily comparable with everyone who browses without assistance, because their readiness to purchase differs. A high conversion rate among users of a feature does not, by itself, establish how many purchases the feature caused. Engagement and incrementality answer different questions.
The measurement implication is to use a genuine hold-out test. AI features are shown to half the traffic and withheld from the other half, with conversion rates and average order value compared over a sufficient period. The difference between those groups measures the incremental contribution. An AI tool’s own attribution dashboard is not a substitute for that comparison.
A store may receive valuable AI referrals, generate an incremental benefit from on-site assistance, or observe high conversion among already motivated users. Those are distinct findings. Putting them into one AI conversion claim would blend different results in the same way that makes the global ecommerce average misleading.
How to build a conversion benchmark that is actually useful for your store
The practical framework begins with industry vertical and average order value band. Together, they help find stores whose customers face similar choices about what to buy. A shared category name is not enough when price points differ substantially. The comparison also needs the same denominator and a relevant seasonal period, so differences in measurement do not masquerade as differences in performance.
The next step is to segment traffic sources before interpreting movement in the blended rate. A decline during paid social expansion has a different meaning from a decline within a stable email cohort. The first may come from a change in how ready visitors are to buy, while the second gives a clearer signal because it tracks a similar group. Email flows warrant their own scrutiny where they reach customers at different decision stages.
Device performance then needs a separate diagnosis. Desktop CVR, mobile CVR and blended CVR describe different aspects of the store’s results and warrant different responses. A change in device mix can explain why the headline rate moved, but a weak rate within a device segment still needs attention.
AI referrals require server-side source tagging so that their acquisition performance becomes visible at all. On-site AI requires a hold-out test to distinguish incremental gains from vendor-reported attribution, which systematically overstates the contribution. One establishes where orders came from, while the other tests whether assistance changed the outcome.
The resulting benchmark is a set of comparisons. It allows a store to distinguish a longer purchase cycle from weak performance, acquisition-led dilution from site deterioration, and observed engagement from incremental lift. That distinction determines where optimisation effort belongs.