Data-Driven Attribution Limitations for Small DTC Catalogs
GA4 defaults to last-click attribution for small stores without flagging the silent switch.

GA4's data-driven attribution model has a volume floor built into its math, and most small direct-to-consumer catalogs never clear it. When that happens, GA4 doesn't say so. It keeps calling the output "data-driven attribution" even after it has quietly folded back into something closer to last-click, and brand operators end up making budget calls on a label that no longer describes what's happening: the volume floor built into GA4's math has quietly reshaped the output. Data-Driven Attribution Limitations for Small DTC Catalogs are the focus of this discussion.
What GA4's data-driven attribution requires to function
GA4 now runs on data-driven attribution by default, and as of September 2023 it retired first-click, linear, time-decay, and position-based models as primary options entirely. Those older models still show up in comparison reports next to DDA results, but they're no longer something a brand can just pick and run with as its primary lens.
DDA works by training a machine learning model on observed conversion paths, and that training needs volume to mean anything. Below that line, the model doesn't have enough path variation to tell a genuine touchpoint effect apart from noise, so its output stops reflecting anything real about channel influence.
"Per conversion action" is the detail that trips people up. Each tracked goal, purchase, add-to-cart, lead form, counts on its own. A brand tracking three separate goals needs to hit that volume in each one individually. It's a fixed structural threshold, immune to adjustment or toggling to lower the bar. It's structural, baked into how the model trains itself on the data it's given.
The threshold sounds reachable when you read it as a number on a page. In practice, most small brands never get near it. The published threshold is 300–400 monthly conversions per conversion action, as reported in S2 and S5. Adoption of MTA has grown, with 75% of companies having adopted it as of 2026, up from 58% in 2024, per S2 (adoption rate is not the same as successful deployment).
Why small DTC catalogs fall below the threshold
Conversion scarcity is a natural output of a thin catalog with limited traffic at this stage. It's just what a thin catalog with limited traffic produces layerfive.com.
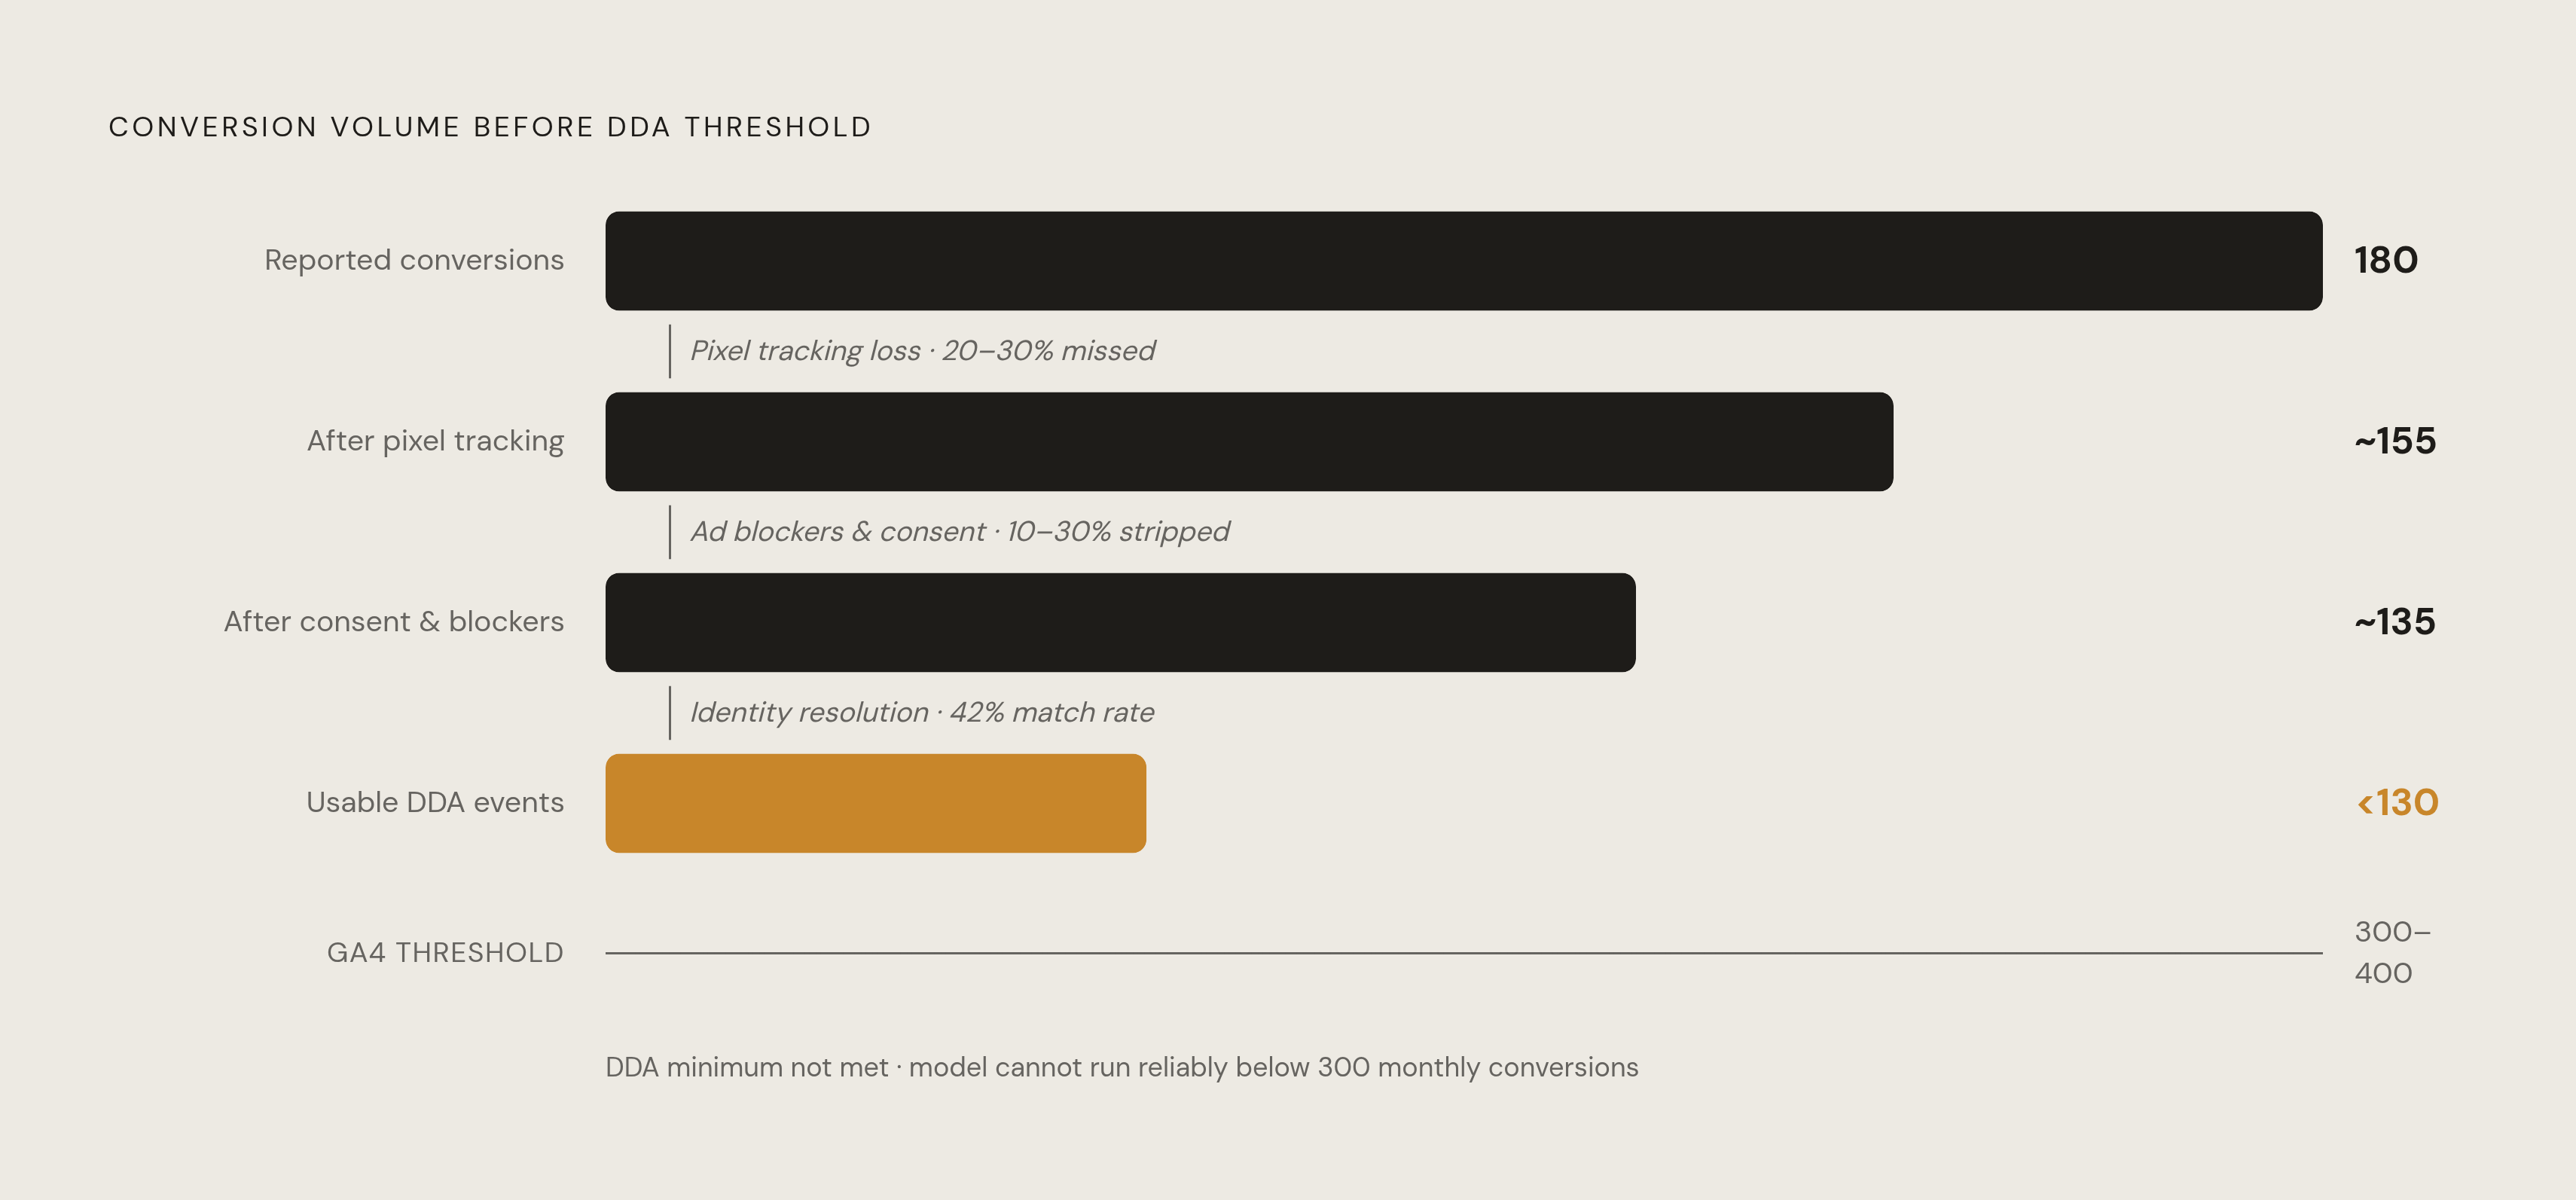
Then tracking erosion stacks on top of that scarcity before the model even gets a chance to run. Apple's iOS 14.5 changes wiped out 60 to 70% of Facebook's attribution accuracy. Standard pixel tracking, even now, only picks up 70 to 80% of actual conversions. GA4 running purely on browser-side tracking loses another 10 to 30% of conversions to ad blockers and consent gaps. Cookie deprecation is expected to touch 78% of existing attribution setups. None of these numbers are catastrophic in isolation, but they compound.
Identity resolution makes it worse still. One real-world DTC setup running anonymous tracking without authenticated login matched just 42% of sessions to a single identity. That's below the 60% match rate where any attribution model becomes unreliable. Below that line, credit gets scattered across what amount to ghost users the system can't tie back together.
A brand reporting 180 raw conversions a month might be feeding the DDA model fewer than 130 clean, resolved events once identity resolution and tracking loss take their cut layerfive.com shopify.com. Small DTC brands are precisely the segment the published GA4 threshold excludes, and yet they're also the segment most likely to be leaning on GA4 as their only analytics tool. The gap is that nobody tells you when you have fallen short of the bar. It's that nobody tells you when you have.
GA4's silent reversion to last-click without flagging it in reports
Below the conversion threshold, GA4 gives no error, no warning banner, no indicator that model quality has degraded. It keeps the label "Data-driven attribution" sitting right there in the report, unchanged.
What actually happens is more mechanical than sinister. Without enough path diversity to work from, the algorithm has nothing left to weight except the final touchpoint, so its credit allocation ends up looking structurally identical to last-click. Google recommends 300 or more conversions per month for data-driven attribution, and below that, the model's behavior degrades without notification to the user.
This is a known limitation of the model design rather than a conspiracy, and the real problem is that it is underdisclosed. But the practical consequence lands the same way regardless of intent: an operator staring at GA4 has no signal that the "machine learning attribution" they're reading is functioning differently from what the label implies. They're making budget decisions off data that's mislabeled, and the tool they trust as neutral ground truth is the one doing the mislabeling.
Last-click attribution's errors in a small DTC buyer's path
Once you accept that last-click is what's actually running under the hood, its distortions follow predictably. Last-click hands 100% of the credit to whatever touchpoint closed the sale and zero to everything that came before it, awareness ads, blog posts, social proof, the first paid ad that ever put the brand on someone's radar layerfive.com.
For DTC e-commerce, where purchase cycles typically run 7 to 14 days and buyers hit multiple touchpoints in that window, a path is rarely single-channel even when the final click looks that way. Branded search and retargeting end up looking like stars because they sit at the finish line of journeys that prospecting and awareness campaigns actually started. Top-of-funnel spend then reads as inefficient, bottom-of-funnel spend reads as unusually strong, and budget follows that signal toward the closers. Prospecting gets cut. The top of the funnel empties out, and eventually the retargeting pool that depended on it shrinks too, a slow puncture that last-click never flags as its own doing.
There's a concrete version of this at ESN and More Nutrition, where separating new customers from existing ones in every single budget decision turned out to be the single largest lever available, and customer acquisition cost fell 70%. That's what happens when a model that can't distinguish acquisition from retention gets corrected for, deliberately, by hand. Last-click, by its nature, undervalues the awareness channels that build a brand in the first place, and for a small DTC catalog with limited product depth, awareness is often the only real mechanism for building consideration before a shopper even has the need in mind. The same conversion path run through two different attribution models shows Channel A collecting 60% credit under one and 18% under the other. That swing usually traces back to an attribution window that's too short or identity resolution that's too fragmented, not some genuine disagreement about what the channel is worth.
Platform attribution windows turning a single sale into multiple claimed conversions
Last-click inside GA4 is only one layer of the distortion. Cross-platform reporting compounds it. Every platform counts conversions inside its own attribution window with zero visibility into what any other platform is claiming for the same sale, and that's a structural feature of how each platform measures, not fraud. The platforms selling the media are also the ones grading how well that media performed, a setup that would raise eyebrows in almost any other part of a business.
Meta's default window runs 7-day click, 1-day engage-through, 1-day view.
On January 12, 2026, Meta removed the 7-day and 28-day view-through attribution windows from its Ads Insights API. On March 3, 2026, Meta redefined click-through attribution to require an actual link click, moving likes, shares, saves, and comments into a separate "engage-through" category. Brands that read the resulting reported drops as a sign of real performance decline and paused campaigns over it were reacting to a measurement artifact.
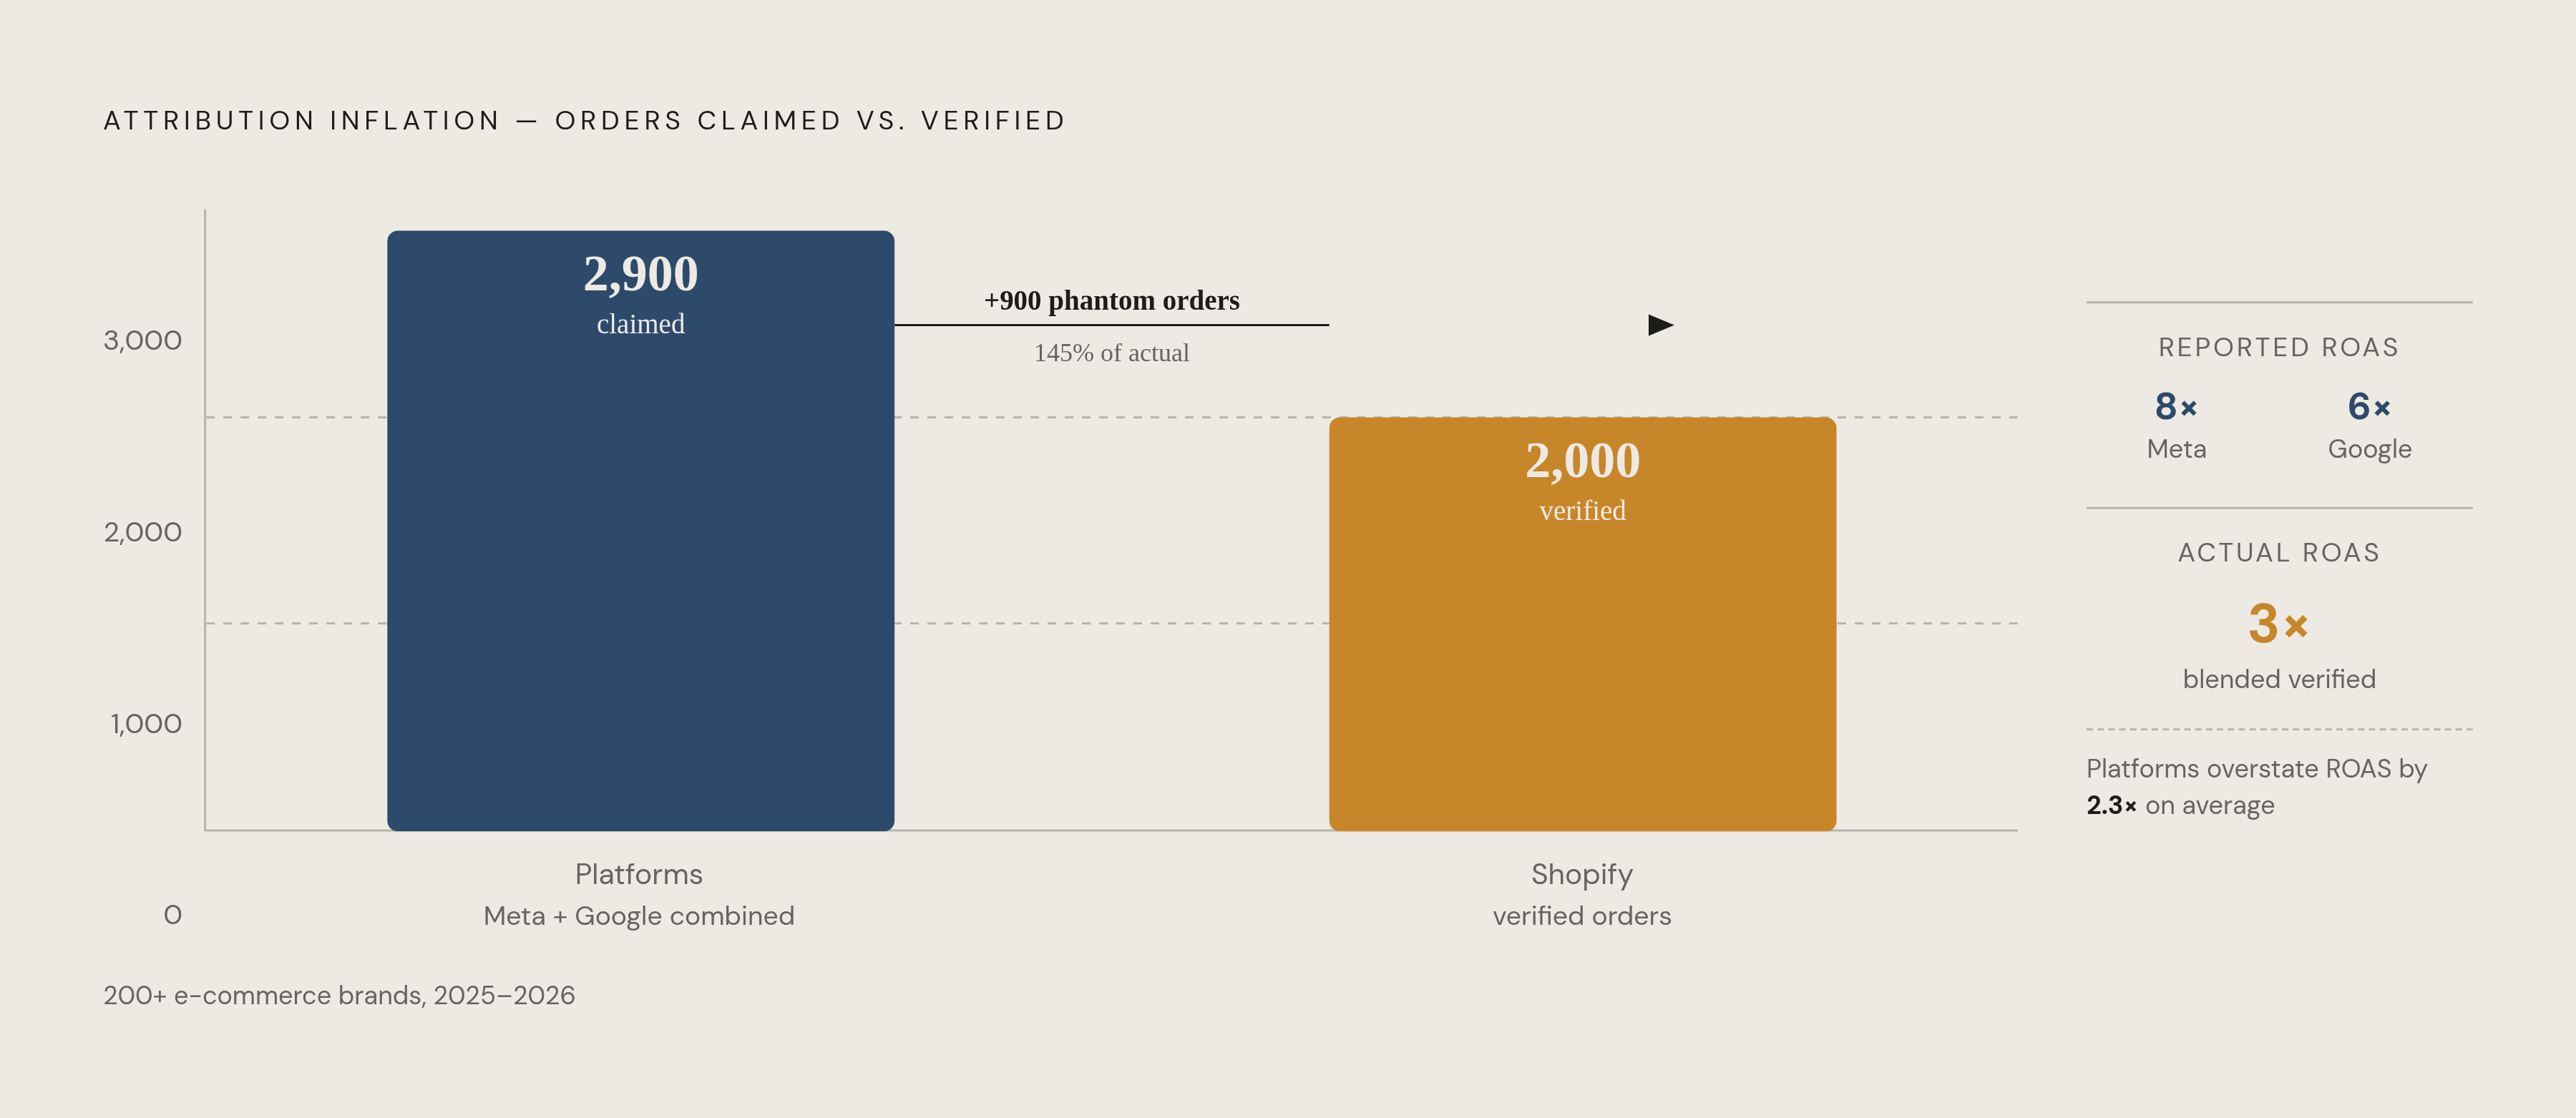
The reconciliation math makes the scale of the problem hard to argue with. One brand with 2,000 actual Shopify orders saw platforms collectively claim 2,900, 145% of what really happened. After deduplicating at the order level, email lost the most credit of any channel, largely because it tends to sit at the end of journeys that paid media started, and nearly a quarter of orders carried no usable source signal at all. Platform rule changes in 2026 made this worse and created measurement whipsaws. Across 200+ e-commerce brands studied in 2025–2026, platforms overstated true ROAS by 2.3×, per S1. If Meta shows 8× ROAS and Google shows 6× but blended actual performance is roughly 3×, the brand is optimizing against fiction, per S1 (GA4's mislabeled DDA is the tool they are using to reconcile it). Understanding the gap is one thing: the industry's proposed solutions (MTA platforms, MMM, incrementality) carry their own costs and constraints that small DTC catalogs often cannot meet.
The limits of multi-touch attribution tools for low-volume catalogs
Third-party multi-touch attribution tools such as Triple Whale, Northbeam, and Rockerbox give a channel-agnostic picture, matching one conversion record against a single buyer's complete path and assigning credit once rather than once per platform. They anchor every conversion to a single order record and match it against one buyer's full path, so credit gets assigned once instead of once per platform. That's genuinely useful: cross-channel visibility, deduplication against a real order, no platform grading its own homework.
What these tools can't do is establish causation. They're still observational instruments. A buyer who touched five channels before checking out tells you what the path looked like, not which of those five channels actually caused the purchase, and that distinction only comes from an incrementality test. Once match rates drop below 60%, attribution fragments across users the system can't fully identify, making any model unreliable regardless of the platform's feature set.
Cost is the other wall small DTC brands run into. These tools tend to make financial sense once combined paid spend crosses roughly $50,000 a month across two or more channels, the point where a 10 to 15% misallocation is worth real money and worth paying hundreds to low thousands a month to correct. Brands spending less than that often don't generate enough conversion volume for algorithmic MTA to be reliable in the first place, which means the tool and the problem it's meant to solve arrive on different scales. Implementations also tend to stall after around six months without clean identity data and a dedicated analyst watching them, resources small DTC teams rarely have spare. The full stack that larger brands run, MTA plus marketing mix modeling plus incrementality testing, is genuinely difficult to reproduce by stitching together point solutions, and every attempt to do so trades off cost, contract length, or implementation time. There is a cost-fit mismatch for small DTC. Only 39% of marketers identified multi-touch attribution as their most-trusted measurement solution in Haus's industry survey, per S1, as confidence has shifted toward causal methods. Incrementality testing is the ground-truth method that fills the causal gap MTA cannot, and it is more accessible than MMM for small DTC budgets.
Incrementality testing as the causal ground truth below the DDA threshold
Attribution records what happened before a purchase. Incrementality testing asks whether a channel caused the purchase at all, and that distinction should guide every reallocation decision a brand makes. The method itself is simple to describe: hold a channel back from a test group, keep everything else steady, and measure the revenue gap against a control group that saw the normal mix. The gap is the channel's real incremental contribution, not its attributed one.
Adoption is moving fast. A survey by EMARKETER and TransUnion found 52% of US brand and agency marketers now use incrementality testing to measure campaign performance. For a small DTC brand, this is more within reach than it sounds: a Meta holdout test or a geo-split test on Google runs on the platform's own native tools with clean baseline tracking, no separate vendor contract required.
The payoff is that incrementality surfaces what path-based attribution hides. A campaign that looks weak by last-click standards might be doing real top-of-funnel work that a different channel later closes and claims credit for, and only a holdout test shows that contribution directly. Ehrenkind's controlled test is a clean illustration of how much measurement quality itself can shift the read on a campaign: a server-side pixel produced 60.3% higher ROAS and 25.2% lower cost per order than the brand's own pixel, in a test where the underlying campaign never changed. The campaign didn't get better. The measurement did.
Incrementality testing does have a floor of its own. Detecting a statistically meaningful gap between test and control still needs enough conversion volume in the test window, and very small catalogs may need to stretch the test period out or run it at the channel level rather than per campaign to get a readable result. Incrementality is a periodic check, not something that updates on a dashboard every morning, and brands still need metrics they can watch day to day that don't depend on DDA working properly at all.
The metrics that remain reliable when DDA fails
A few numbers hold up regardless of what any attribution model is doing underneath them. CAC payback under 90 days keeps cash flow workable.
MER deserves particular trust because of how little it asks for. It's total revenue divided by total ad spend, measured at the store level, with no model to train, no identity to resolve, and no conversion threshold to clear. It degrades gracefully even when tracking underneath it is a mess, which is the opposite of how DDA fails.
Ranking campaigns by ROAS instead of contribution margin can lead a brand somewhere quietly wrong even with flawless attribution. The higher ROAS number looks like the better decision on a dashboard, and it's the wrong one every time margin tells a different story. These metrics don't need attribution to be honest, because they were never asking attribution's question. Per the 2025 State of DTC Marketing Report, cited in S1, priorities have moved from visibility to profitability, with conversion rate (75%), CAC (63%), CLV (54%), and AOV (50%) now leading (nudgenow.com). The LTV:CAC ratio has a healthy range of 3:1 to 5:1. Contribution margin is healthy above 35%; the median DTC contribution margin fell from 35% in 2021 to 22% in 2025 as paid acquisition costs climbed, per S1. MER, the marketing efficiency ratio, runs 2.5× to 4× for profitable brands. The 60-day cohort repeat rate is a relevant metric. A campaign at 4× ROAS on a 22% margin loses money, while one at 2.5× on a 48% margin makes it (ranking on ROAS instead of contribution margin produces the wrong budget decision even with perfect attribution, per S3's worked example).
Sources
- 12 Best Multi-Touch Attribution Solutions (2026)
- Cross-Platform Attribution Challenges & Solutions: Post-iOS14 DTC Marketing in 2026 | ATTN Agency
- An Overview of Data-Driven Attribution in GA4 | Cardinal Path
- GA4 Per-Conversion Attribution Settings Guide 2026
- GA4 Data-Driven Attribution Minimum Requirements: Why Small Stores Get Last-Click
- GA4 Data-Driven Attribution Is a Black Box: How to Take Control
- GA4 Limitations: Rethinking Attribution in Analytics
- Marketing Attribution Tools for DTC Brands (2026) | QRY